Market Recap for Friday, August 2, 2019
The latest nonfarm payrolls report came in, but quite honestly no one seemed to care. The Fed has already said its piece and was rather noncommittal to another rate cut and both bond and equity markets are fixated on the US-China trade war. It doesn't happen often, but jobs really were not the focus on Friday.
Our major indices all fell as fears about the possible ramifications of an intensifying trade war reignited. Technology (XLK, -1.63%) and energy (XLE, -1.44%) were the primary laggards, although the defensive real estate (XLRE, +0.77%) and consumer staples (XLP, +0.02%) were the only two sectors to end the session in positive fashion. There's clearly been a rush to safety since the Fed's lack of transparency on Wednesday afternoon. The tweets and trade war are simply intensifying the uncertainties right now. The stock market does not do well with uncertainty as we're finding out once again.
Pre-Market Action
China has retaliated in the trade war, lowering its currency to its lowest level since 2008, and asking its state companies to abandon purchasing U.S. agricultural products. Market participants are simply selling and asking questions later. That's weighing on futures as we start a new week.
With 30 minutes left before a new trading day and week begins, Dow Jones futures are set to open 375 points lower.
Current Outlook
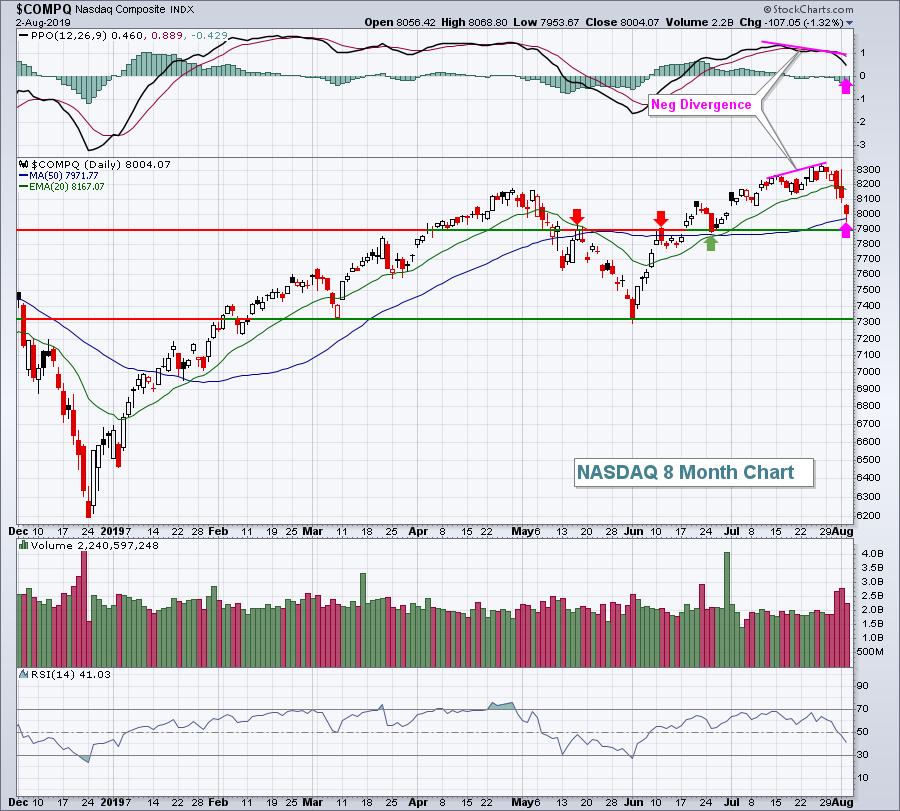
Futures are pointing much lower this morning. Unless we see a big reversal today from the open, we could be setting up for more short-term pain. Here's the level I'd be watching on the NASDAQ:

The June 25th close was 7884. A close beneath that level would open the door to a major intermediate-term double bottom near 7300. While I don't believe we drop that far, anything is possible with a VIX in the 20s. The stock market is completely irrational when the VIX accelerates higher. Earnings don't matter. Nothing matters. To fully protect yourself, cash is the answer.
Sector/Industry Watch
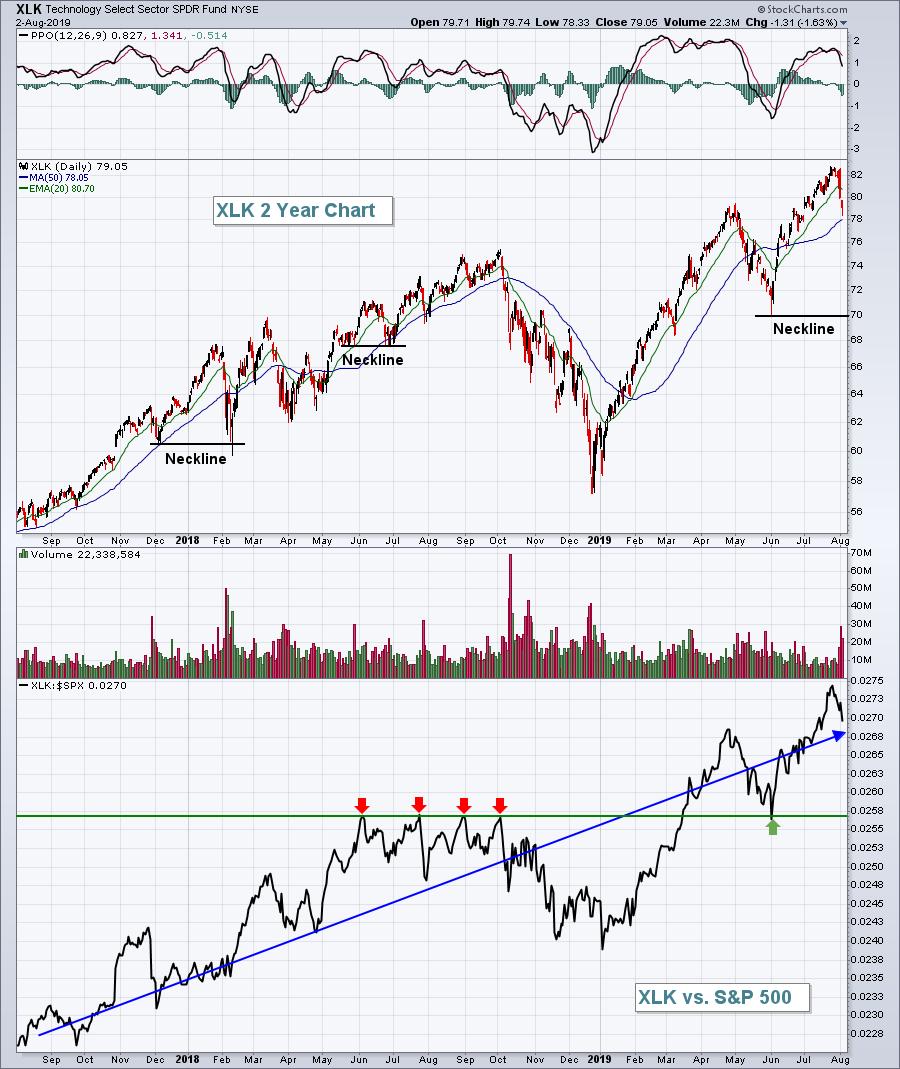
Clearly, the most vulnerable area of the market is technology (XLK) as it's been the leader throughout the summer. We saw a recent top here and I expect, given the emerging fear, that we're beginning to form a continuation pattern. It's way too early to assume which pattern will form, but the uptrend is firmly in place. The mistake that I believe many traders and analyst will make, assuming the weakness accelerates, is that a topping head & shoulders pattern is forming:

I'd watch the 50 day SMA. If the XLK closes beneath that level, there isn't a lot of support until we reach that prior low in early June. That would definitely be considered a neckline, but just remember that head & shoulders patterns don't confirm until the neckline is broken. I know we've only seen a few days of weakness and I'm likely getting way ahead of myself. But just remember this chart is the weakness picks up. Prior "necklines" were never broken in 2018 as the stock market soared to fresh all-time highs. While growing bearish is important when the time is right, growing bearish too early can be much worse. It's fine to be cautious right now, but I'd avoid becoming bearish. It's way too early for that.
Monday Setups
It's difficult to trade with the current backdrop of rising volatility and uncertainty. We never know what we're going to wake up to. Right now, it's mostly the Fed and the US-China trade war. As trade war tensions escalate, volatility rises further and sanity goes right out the window. High volatility is the one thing that trumps solid technical analysis. It's simply irrational market behavior. Therefore, if you must trade a market with a Volatility Index ($VIX) in the upper teens or into the 20s, do so with an abundance of caution and with fewer shares.
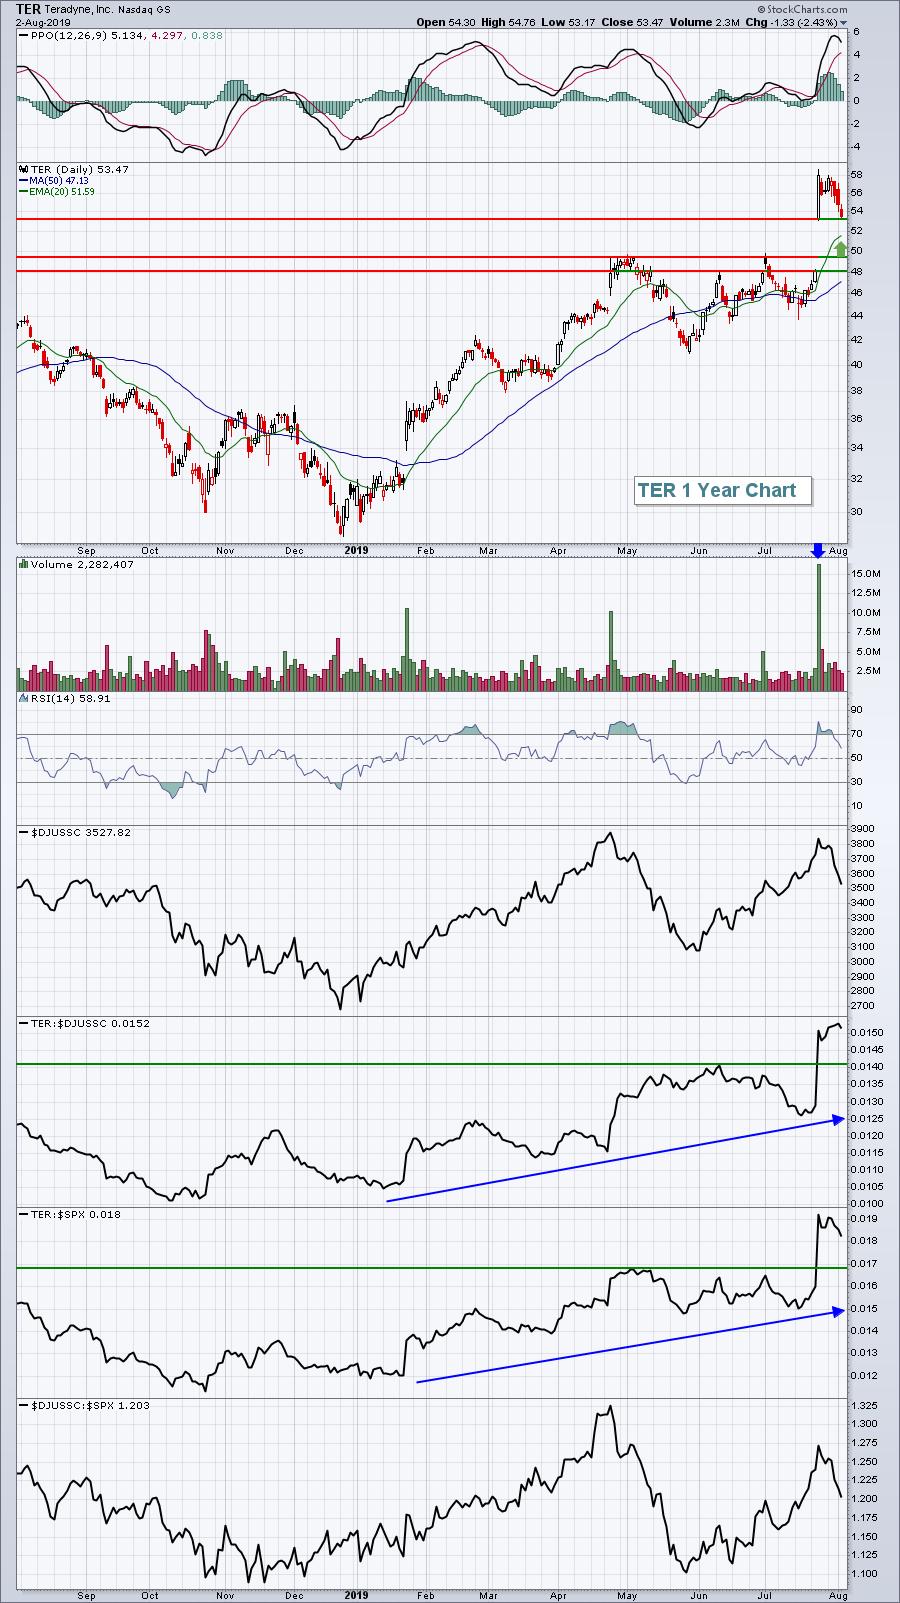
My favorite stock as we enter the week for a short-term trade would be Teradyne, Inc. (TER), which recently blew away revenue and EPS estimates. But it can be easily manipulated during trade tensions, which makes it much riskier. I'll simply give you a chart and the various levels of support to watch for possible reversals:

I love to trade the top of gap support, which in TER's case would be close to its current price. But given the high volatility, we might see lower price support levels reached. The May/July double top that was cleared with earnings could provide support, as could the bottom of gap support. A fourth possibility would be the rising 20 day EMA. Accumulation in this 48.00-53.50 area would be prudent, but given the high volatility, trying to predict the best entry is pointless. I would simply have the mindset that falling equity prices would present a great opportunity here and, when the dust settles, I'd look for TER to challenge its recent high.
Historical Tendencies
U.S. indices struggle during August and September as I've been pointing out recently. Here's a breakdown of NASDAQ historical performance and annualized returns during the month of August (since 1971):
August 1-6: -13.57%August 7-10: -1.93%August 11-18: +26.44%August 19-25: -2.87%August 26-31: +6.98%
The most unusual part of the NASDAQ's August history is the first six days. In most calendar months, we see the most bullish activity in the first six days, but not in August.
August 2019 isn't helping either.
Key Earnings Reports
(actual vs. estimate):
ATH: 1.95 vs 1.81
CNA: 1.08 vs 1.01
JEC: 1.40 vs 1.25
KMPR: 1.38 vs 1.36
L: .82 vs .75
LIN: 1.83 vs 1.71
ON: .42 vs .42
TSN: 1.47 vs 1.47
WEC: .74 vs .70
(reports after close, estimate provided):
ANSS: 1.28
BHF: 2.23
BKH: .45
BWXT: .52
CIB: .95
CLR: .60
CSOD: .20
CZR: (.03)
DEI: .53
EVBG: (.09)
IFF: 1.61
KLAC: 1.71
MAR: 1.56
O: .81
OUT: .65
PODD: .03
RAMP: (.30)
SHAK: .22
STE: 1.11
TTWO: .03
UGI: .20
WPX: .07
WWD: 1.17
XEC: 1.20
Key Economic Reports
July PMI services index to be released at 9:45am EST: 52.2 (estimate)
July ISM non-manufacturing index to be released at 10:00am EST: 55.5 (estimate)
Happy trading!
Tom


