Below is today's Daily Market Report that I send out to EarningsBeats.com members every day, usually between noon and 1pm EST. Enjoy!
Executive Market Summary
- Wall Street opened lower, but key indices are now flirting with positive territory
- January CPI indicated inflation remains modest
- The 10 year treasury yield ($TNX) is lower by one basis point to 1.62%
- Asian and European markets are drifting lower
- Gold (GLD) and crude oil ($WTIC) are up 0.50% and 0.70%, respectively
- Cisco Systems' (CSCO, -5.47%) earnings disappoint; Applied Materials (AMAT, +5.78%) beats expectations
- We have one active trade alert, which is giving back a portion of yesterday's gain
Market Outlook
As many of you know, I follow the XLY:XLP ratio (consumer discretionary stocks vs. consumer staples) as confirmation of a bull market. This ratio has been consolidating for awhile, which is fine and healthy, but Amazon.com's (AMZN) strong earnings and move higher has triggered a breakout to a 6 month high in this ratio:
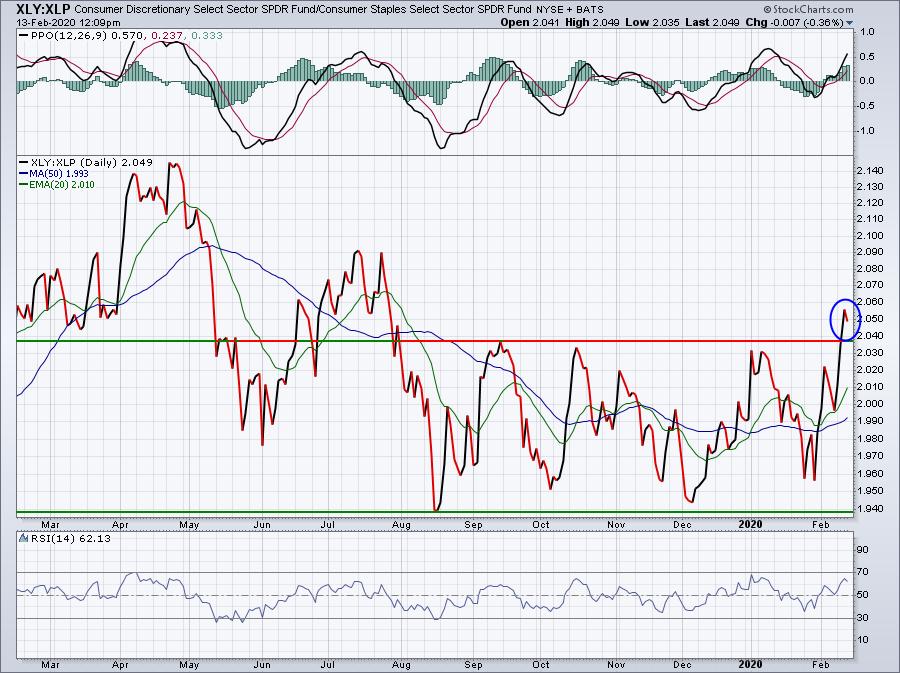
AMZN represents 23% of the XLY, so its recent breakout has definitely resulted in this ratio breakout. Nonetheless, any time that discretionary stocks are outperforming staples, I find it bullish.
Sector/Industry Focus
The Dow Jones U.S. Health Care Providers Index ($DJUSHP) broke out yesterday and are in the process of extending that breakout today. On my Trading Places LIVE show this morning, I highlighted the healthcare group (XLV), including all 5 industry groups. I believe they are all in very bullish patterns. Here's a look at the DJUSHP:
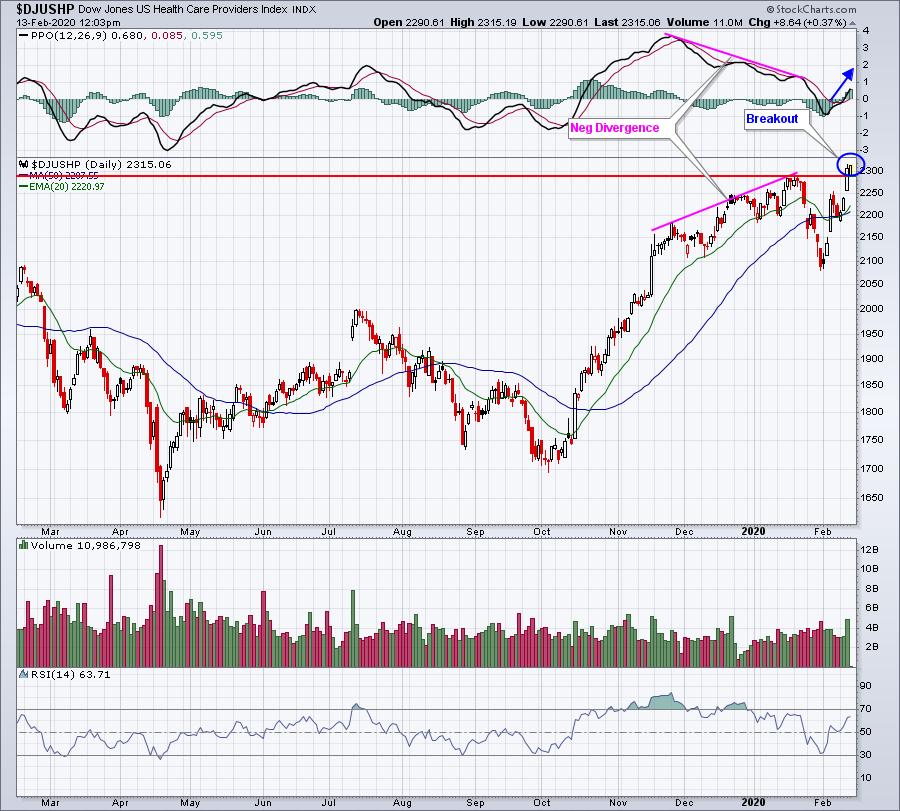
There were momentum issues, but the move back to the centerline "reset" the PPO and now we're beginning to see momentum accelerate once again. Despite red futures this morning and a gap lower, the DJUSHP has rallied back and is confirming this breakout.
Tomorrow morning, I'll provide my favorite health care provider stock in the free EB Digest newsletter. If you'd like to begin receiving this free newsletter every Monday, Wednesday, and Friday, simply provide your name and email address HERE.
Active Trade Alerts
Currently, we have one active trade alert, as follows:
DKS (-1.26%) - reports its next earnings on March 10th. The short-term reversal played out for just one day and DKS failed again as it neared its declining 20 day EMA. A breakout above that moving average would be very bullish, but clearly we'll need more buyers (or less sellers) to clear it. DKS is off its intraday low.
Strong Earnings ChartList (SECL)
I reviewed the SECL and looked at stocks with the best performance today. Here are the three top performers, highlighting the importance of the price support levels that I provide on these charts:
RAD:
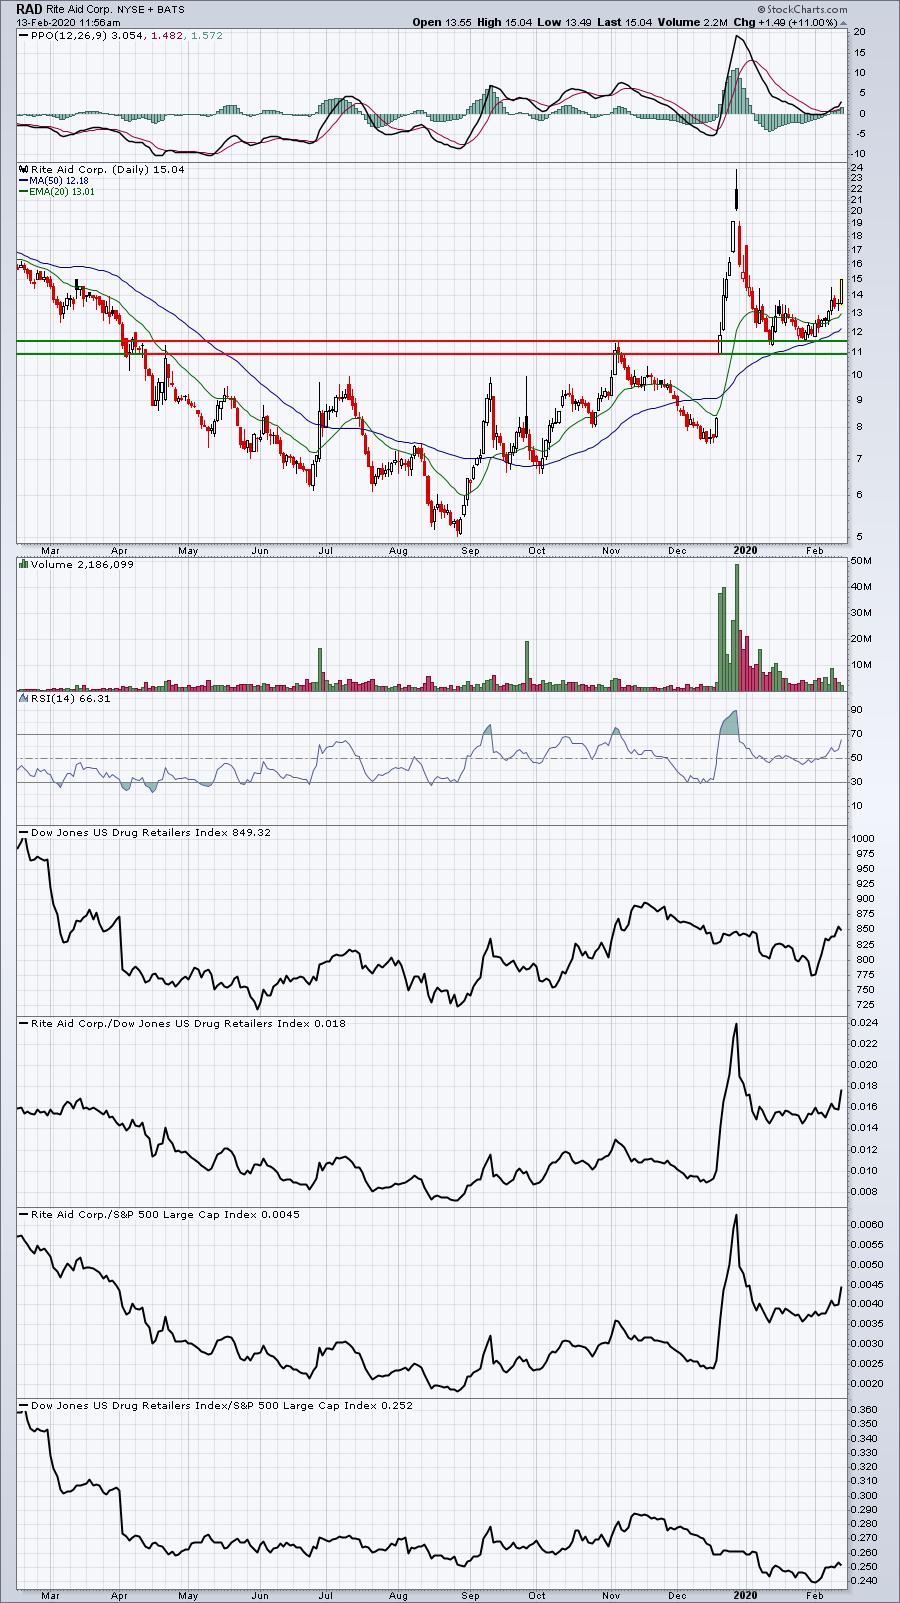
Initial support near 11.50 proved to be great entry. Unless we see a big reversal this afternoon, I'd look for RAD to challenge the 17.25-17.50 area.
GLUU:
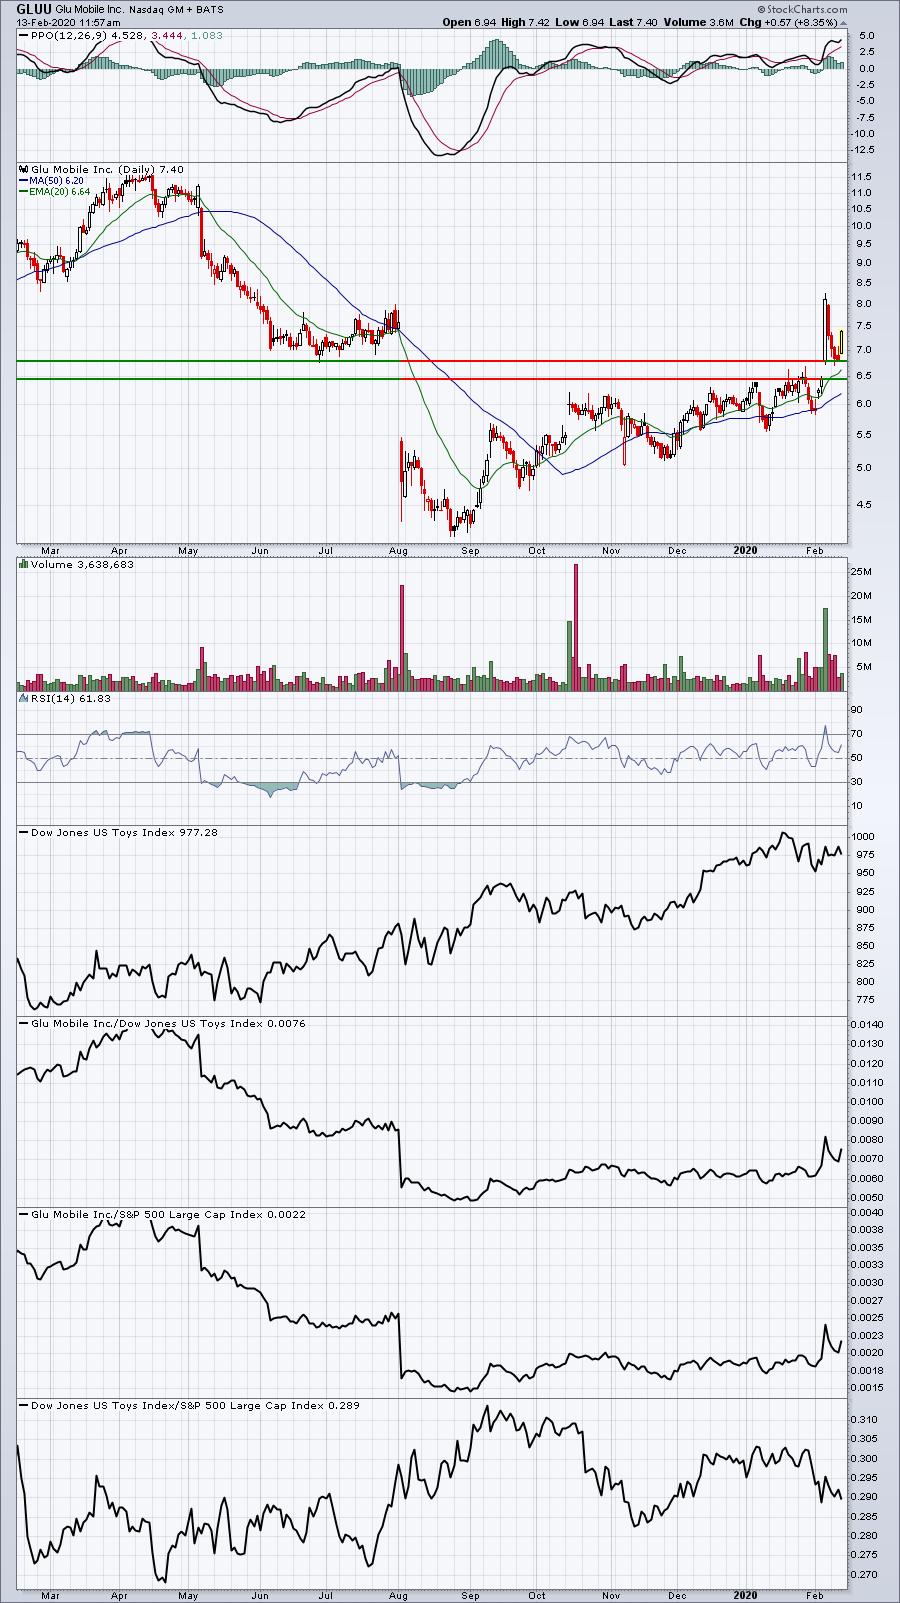
GLUU bounced right off the top of gap support with its recent close above 8.00 as a short-term target.
OGI:
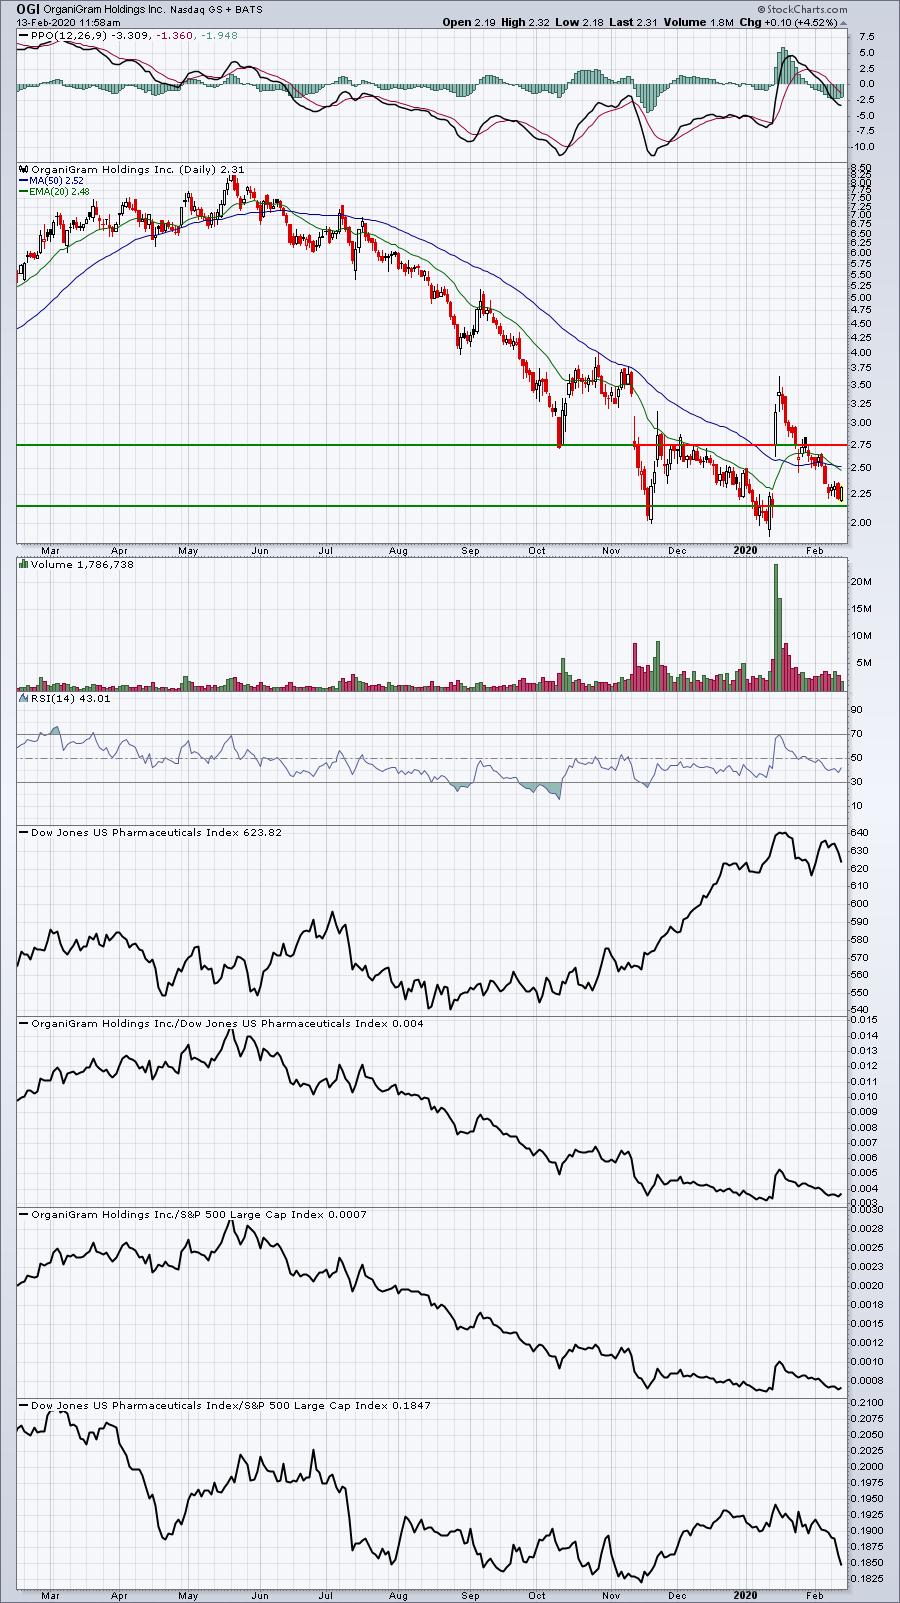
It's been a long, steady drop for OGI, but today's reversing candle occurred just above the bottom of gap support. The 20 day moving average at 2.48 will be the first challenge for the bulls.
Movers & Shakers
I looked at the 10 worst performers on the S&P 500 today and wanted to discuss a couple:
NTAP:
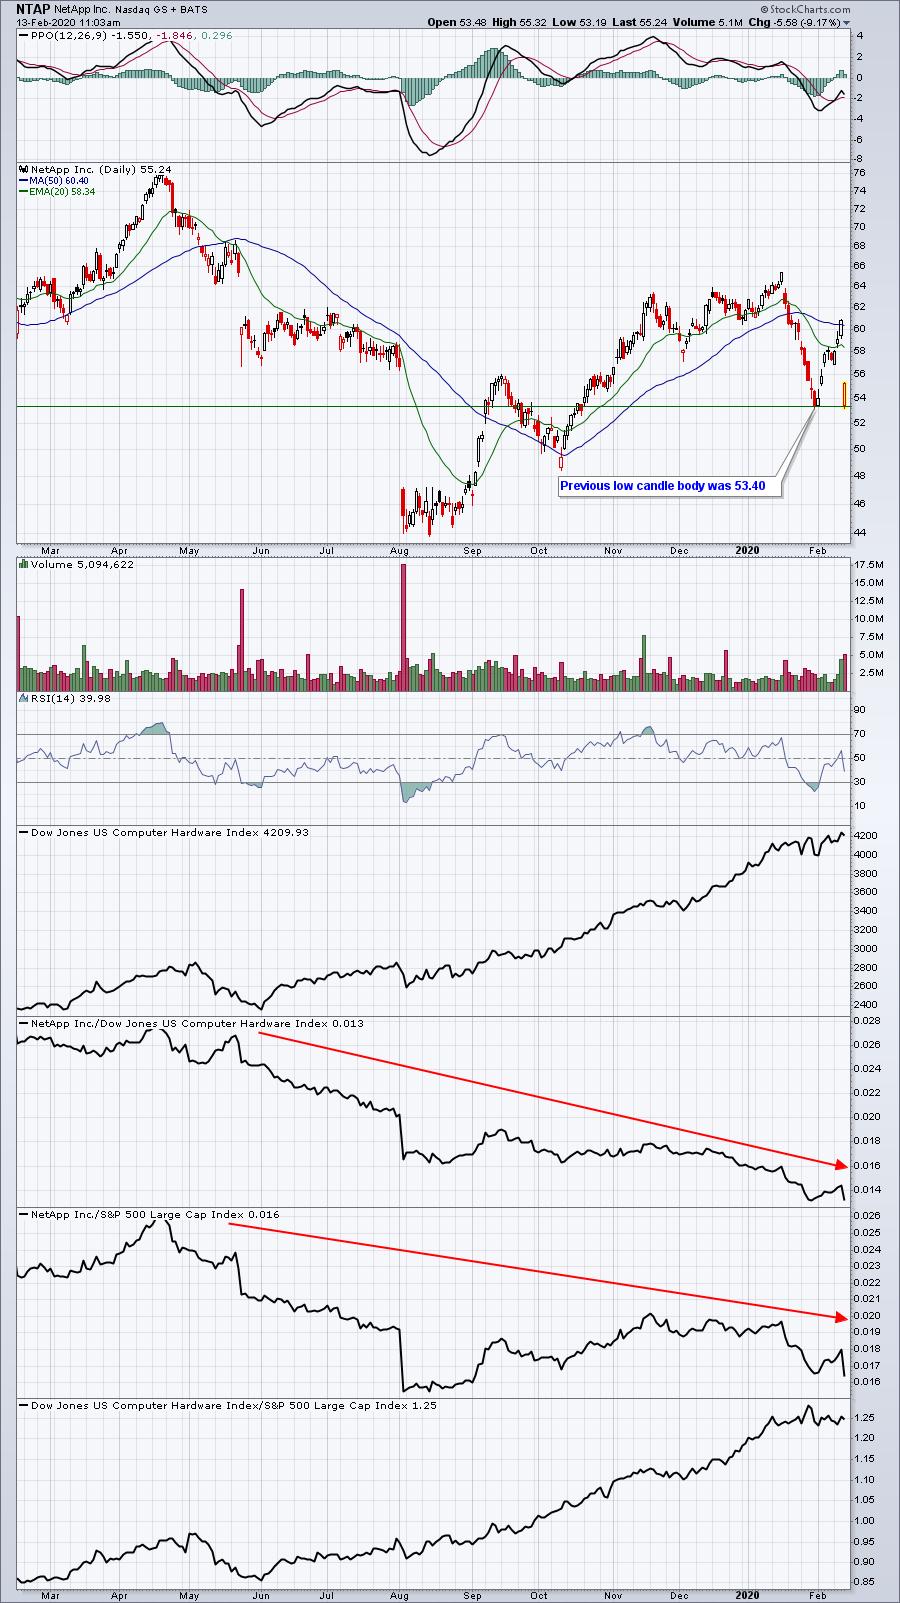
During my Trading Places LIVE show this morning on StockCharts TV, I explained one potential trading strategy with NTAP. I said that if NTAP were to open above its prior candle body low at 53.40, then trade beneath it and begin to rally again, buying NTAP as it moved back through the opening price could represent a short-term trade. Why? Think about the market maker role. NTAP missed revenue expectations. They missed EPS expectations. They cut guidance. It was a dismal report and the masses wanted OUT at the open, so sellers were everywhere at the opening bell. Market makers provide liquidity (the other side of the trade when there's an imbalance of orders). If there's one thing you need to be aware of as a trader, it's that market makers rarely lose money. Market makers see the order flow and determine the "appropriate" opening price. A gap down below 53.40 would trigger a breakdown at the open. A gap down above that 53.40 would not represent a breakdown at the open. So if initial selling moves beneath that prior low and then rallies, it's a false breakdown, and I can make the assumption that market makers are on the long side. You do have to remember that market makers TRADE, they don't invest. So if you use this strategy, consider riding the trade for as long as the price rises (but personally I'd exit before the close - I would not hold overnight). A trailing stop should be considered.
If you're wondering how to put in a horizontal line onto your chart at exactly 53.40, it's under the "Overlays" area as shown below:
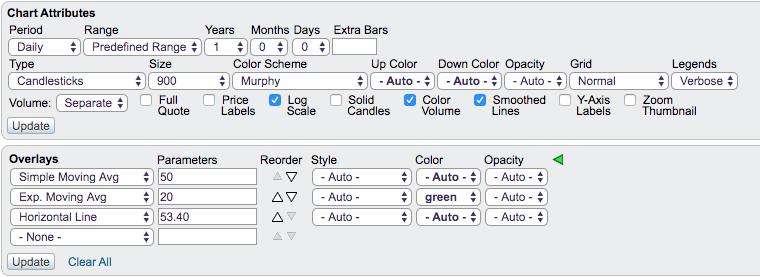
Select "Horizontal Line" and type in the price under "Parameters". Voila!
HII:
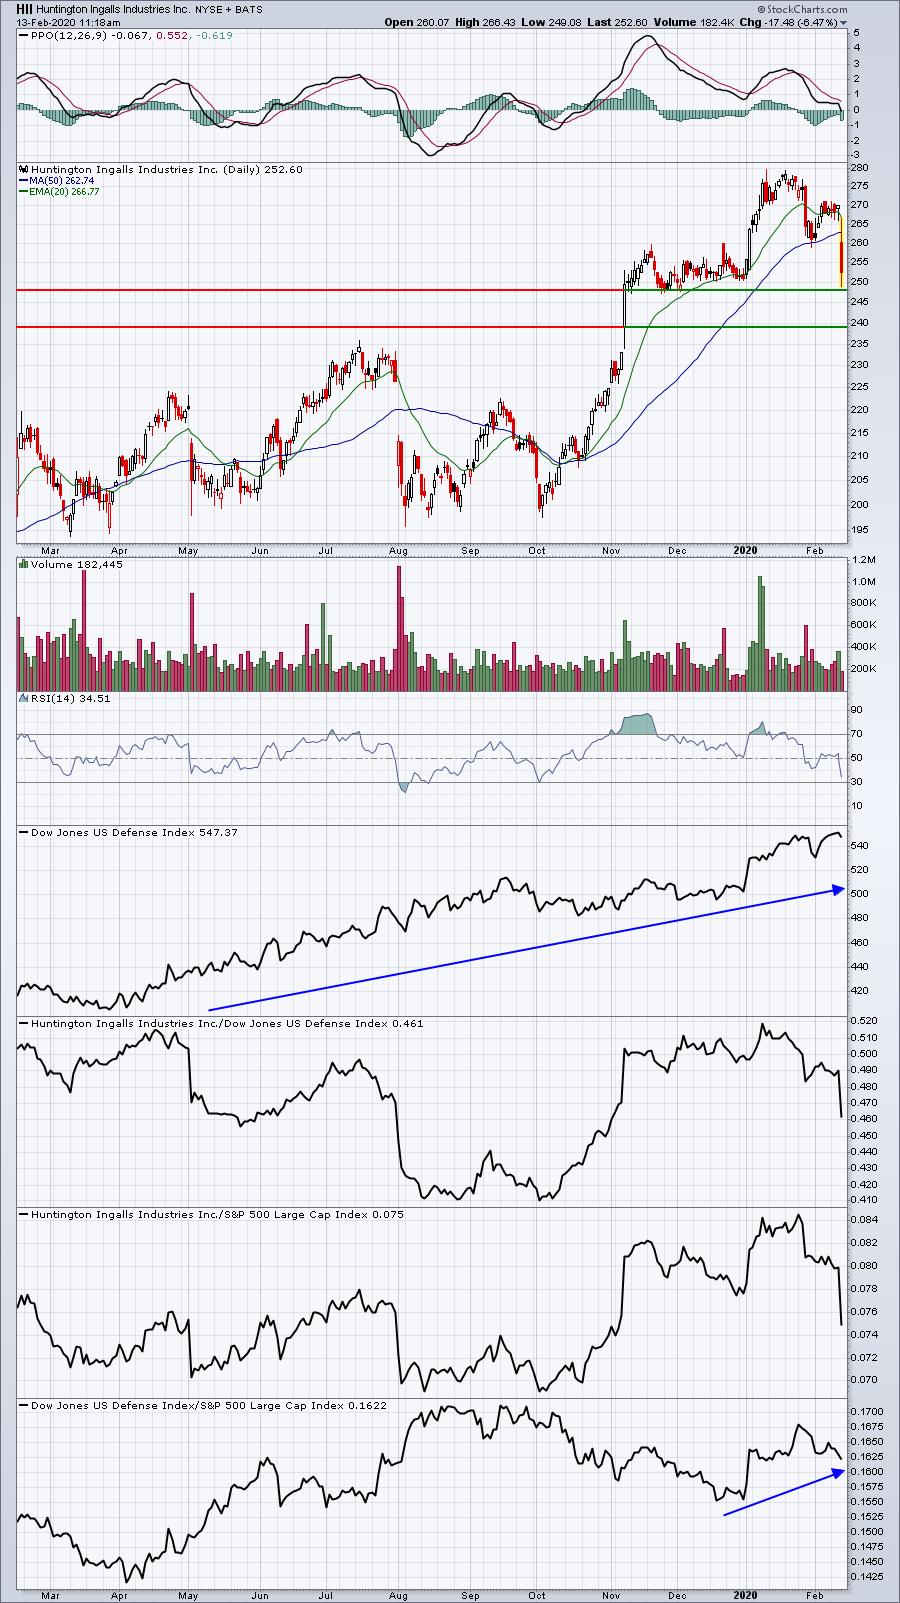
HII also reported earnings and they weren't bad. They beat both top and bottom line estimates and I didn't see any negative guidance. This selling could prove to be an opportunity. I've drawn two key price support levels that I'd watch (or use to accumulate if you'd prefer). Gap support near 239 is the level that I'd want to make sure holds.
Earnings Reports
Here are the key earnings reports for this week, featuring stocks with market caps of more than $10 billion. I also include a few select companies with market caps below $10 billion. Finally, any portfolio stocks (or active trade alerts) that will be reporting results are highlighted in BOLD. Please make sure you check for earnings dates for any companies you own or are considering owning:
Thursday, February 13:
BABA, PEP, NVDA, LIN, FIS, DUK, ZTS, WM, TRP, AIG, BCS, KHC, RSG, CCEP, DLR, DXCM, FTS, LH, ANET, INCY, EXPE, ROKU, AEM, DDOG, ZBRA, FNF, LBTYA, WST, GDDY, BIO, HII, NICE, BKI. Others less than $10 bil: MHK, AYX, IPGP, GNRC, TPX, HUN, YETI
Friday, February 14:
AZN, ENB, PPL, YNDX. Others less than $10 bil: NWL, CGC
Economic Reports
January CPI: +0.1% vs. +0.2%
January Core CPI: +0.2% vs. +0.2%
Initial jobless claims: 205,000 vs. 211,000
Happy trading!
Tom


