I'm a historian at heart. I absolutely love analyzing history to see what makes the market tick. It's why I turned my attention from fundamentals to technicals a few decades ago. Technical analysis is the study of price action to help forecast future price action. The stock market is a lifelong case study of "history repeating itself". Throw in the study of human behavior during extremely emotional and volatile periods and we begin to get a sense of what we might expect as we move forward. Here's what history SCREAMS at me and what you routinely hear from Warren Buffett, one of the greatest investors of our lifetime - buy when others are fearful.
I'm fairly certain that losing one third of the combined market cap of all U.S. companies in a month or so qualifies as fearful. I don't know if we've definitively reached the depths of despair, but we're getting really close if we haven't. As I look at 2020 and the carnage that's been left behind thus far, there are few periods in history that compare. Looking at the Q4 2018 losses pales in comparison. So too does the consolidation in 2015 and 2016, or the flash crash of 2010. Honestly, the only two periods that are in the same ballpark are the financial crisis of 2008 and the market crash of 1987. Personally, comparing to 1987 makes the most sense to me because the entire crisis began at the top during a secular bull market and a one third drop occurred in just 3-4 weeks - eerily similar to 2020.
But let's look at how the bottoms formed and how the recoveries shaped up during both years:
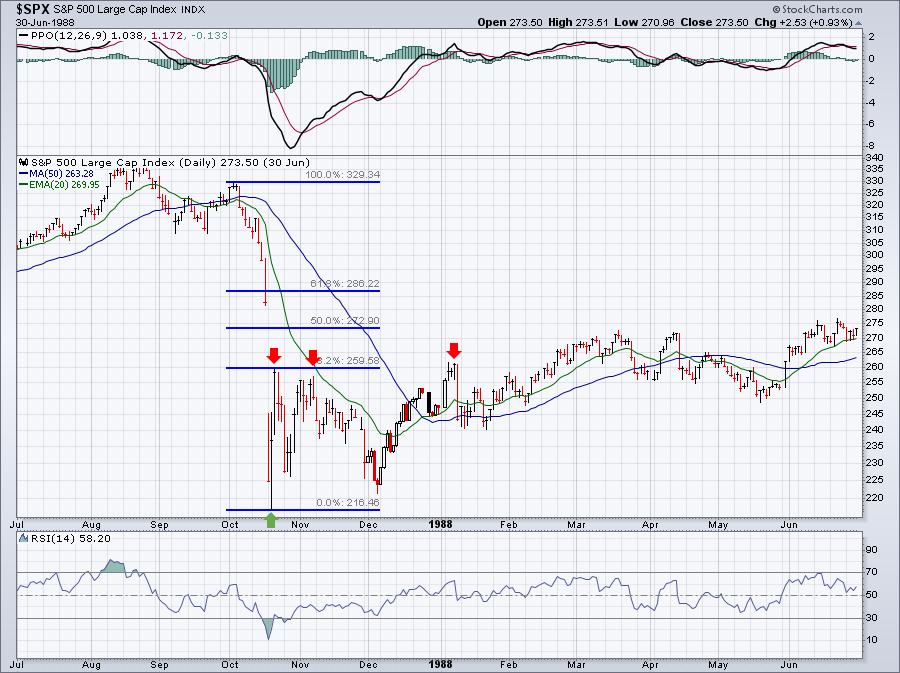
1987 Market Crash:
2008 Financial Crisis:

The key parallels that I see are:
(1) Daily PPO, which measures momentum, both reached into the -7 to -8 territory. Those are the only two times we've seen that acceleration of downward momentum, other than from 1929 through 1932.
(2) Both initial drops totaled roughly 33%
(3) The first critical Fibonacci retracement area at 38.2% served as major resistance levels in both cases, although we did see a brief intraday rally in 2008 that nearly reached the 50% retracement level.
So let's fast forward to 2020 and see how this fits into our current environment:

If we've truly hit a key short-term bottom, then a 38.2% retracement would recover a little more than 20% as we head back toward the 2650 level. As we approach that level, those with a shorting bias would begin to see a solid reward to risk entry point on the short side - and with a target of recent lows for a retest of that low. Also, check out the daily PPO, which has now exceeded the readings in both 1987 and 2008, which are marked with blue horizontal lines. It's clearly time for a bounce based upon history and futures are setting us up for at least an initial phase of that bounce.
From a long's trading perspective, establishing a bottom and seeing a bounce is the very first step in creating a tradable bottom. If we do, in fact, see a sizable bounce to or near the 2650 level, I'd be a buyer on any future retest of the low established yesterday.
Get ready because the fireworks haven't ended. I'd say we still have the finale to go.
The next 30 days are going to be critical for Wall Street and I'd love to keep you posted along the way. We have a fully refundable $7 30-day trial. CLICK HERE for more information.
Happy trading!
Tom


