Happy Cinco de Mayo to all! Below is my Daily Market Report that is sent out every day to EarningsBeats.com members. If you'd like to subscribe, I'd love to have you join our growing community! Here's a link:
Fully refundable $7 30-day trial
Guest Appearance on StockCharts TV's "Your Daily 5"
StockCharts TV's "Your Daily 5" is broadcast at 1pm EST every day and yesterday I had a guest appearance and provided my 5 charts/themes that viewers should pay attention. Be sure to check it out if you weren't able to yesterday. You can watch it by CLICKING HERE.
Executive Market Summary
- Futures were strong overnight and U.S. indices opened higher
- The NASDAQ is up 2.12% at last check, leading the major indices
- Earnings are ramping up with many leaders and laggards posting quarterly results
- Crude oil ($WTIC) continues its march higher, gaining another $4 per barrel to $24.42
- Strong action in Europe helped to buoy U.S. stocks
- Healthcare (XLV) and technology (XLK) have returned to their leadership roles
- We have no active trade alerts at this time
Market Outlook
I talk about the Volatility Index ($VIX) a lot, specifically how extremely high readings can mark major bottoms and potential reversals. Well, following what takes place in the options world also can provide great market clues. The equity only put call ratio ($CPCE) is another sentiment indicator that tells us what retail traders are doing and thinking. When the masses of retail traders get on one side of the option trade, we typically see a reversal. Check out the following chart:
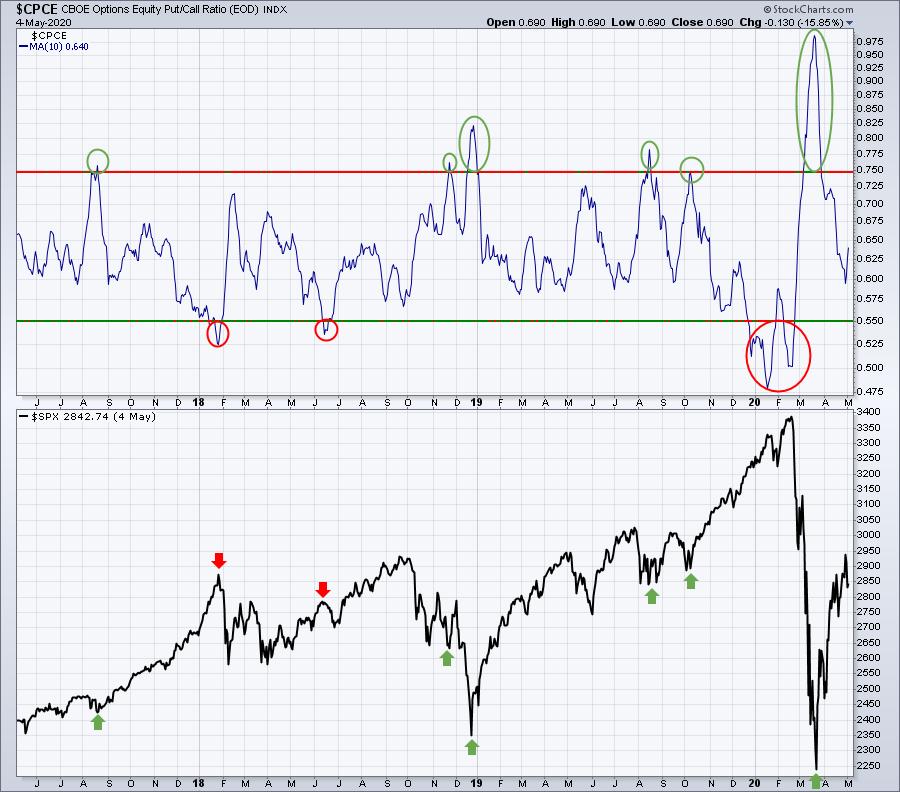
Understand first that the top part of this chart is the 10 day moving average of the CPCE. The red circles highlight when this 10 day moving average reaches 0.55 or below. Low CPCE readings mean that many more calls are being traded than puts. It's an indication that retail traders are growing excessively bullish. Note that the stock market struggles (red arrows) when retail traders grow too bullish. It doesn't mean that we're entering a long-term bear market, but it should warn short-term traders to think about locking in profits, or at the very least, hedging.
The opposite holds true when this 10 day moving average rises above the 0.75 level (green circles). This suggests that retail traders are growing waaaay too bearish in the near-term with almost as many puts being traded as calls over a 10 day period. That pessimism tends to coincide with market bottoms (green arrows).
It's generally a good idea to watch this chart periodically, if you trade with a shorter-term mindset.
Sector/Industry Focus
The sector leaderboard once again shows us that health care (XLV) and technology (XLK), the two best sectors throughout the pandemic, are leading the market higher today:
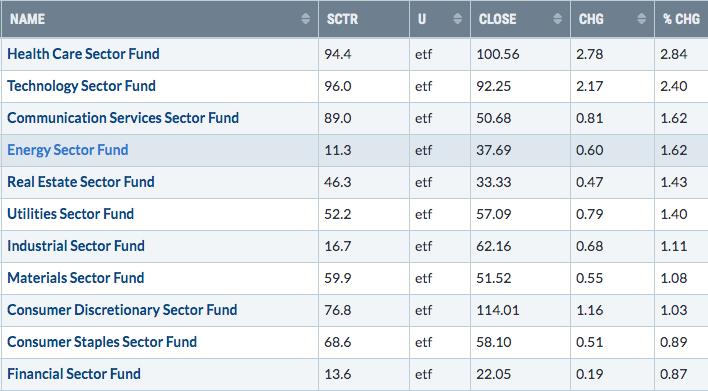
Financials (XLF) are lagging today and can't seem to catch a bid, even though the 10 year treasury yield ($TNX) has been moving higher most of the last week:
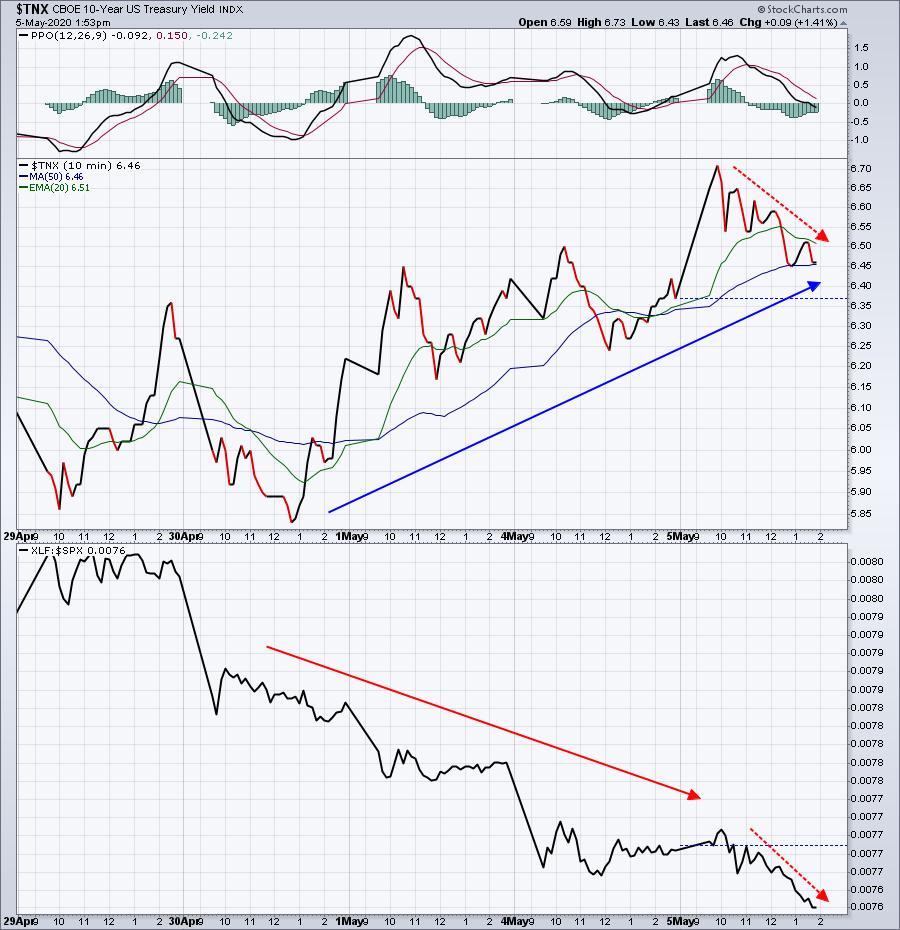
Financials underperformed while the TNX was rising, then really accelerated lower when the TNX rolled over today.
Strong Earnings ChartList (SECL)
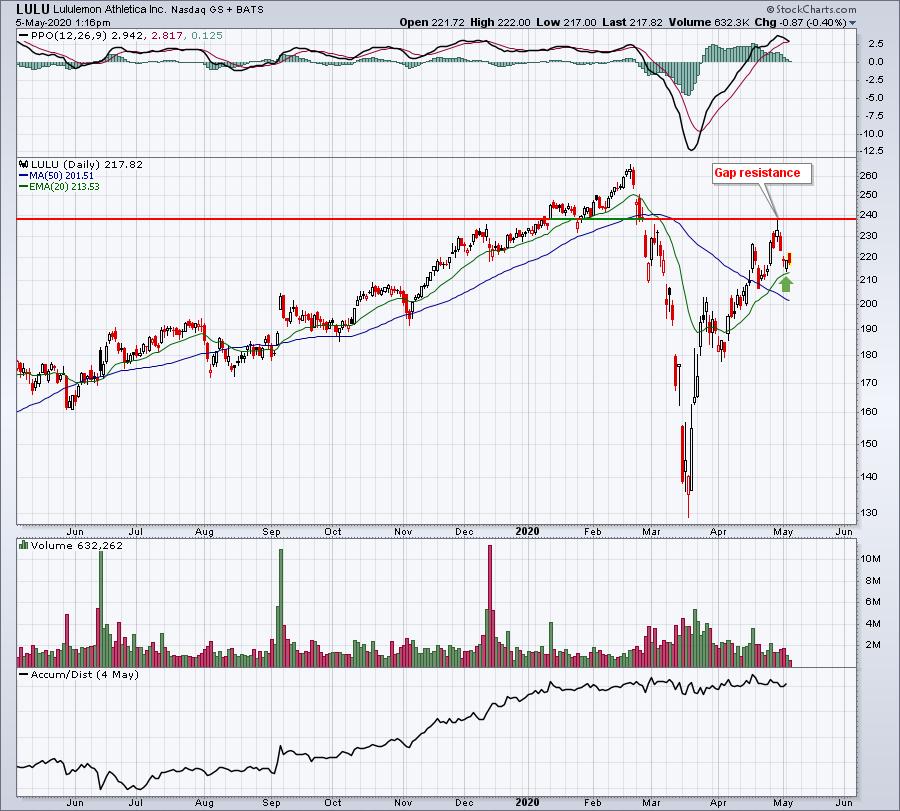
More and more companies are beginning to reverse off of recent downtrends, so I thought I'd highlight a couple of them on the SECL:
LULU:
MMSI:
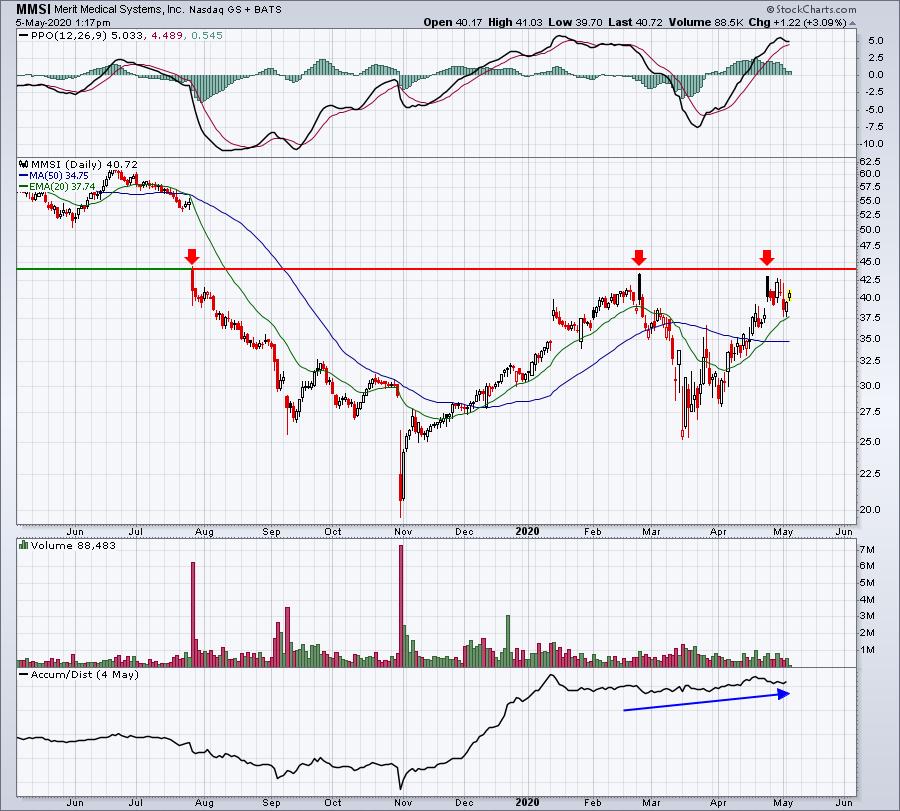
Both of these stocks appear poised to move higher, in my opinion. On MMSI, a break above 44.00 would likely trigger a number of technical buy signals. LULU gapped up at the open and has pulled back, providing a better reward to risk entry point.
Strong and Weak AD ChartLists
Here are a few Strong AD ChartList stocks that also appear to be reversing off key 20 day EMA tests:
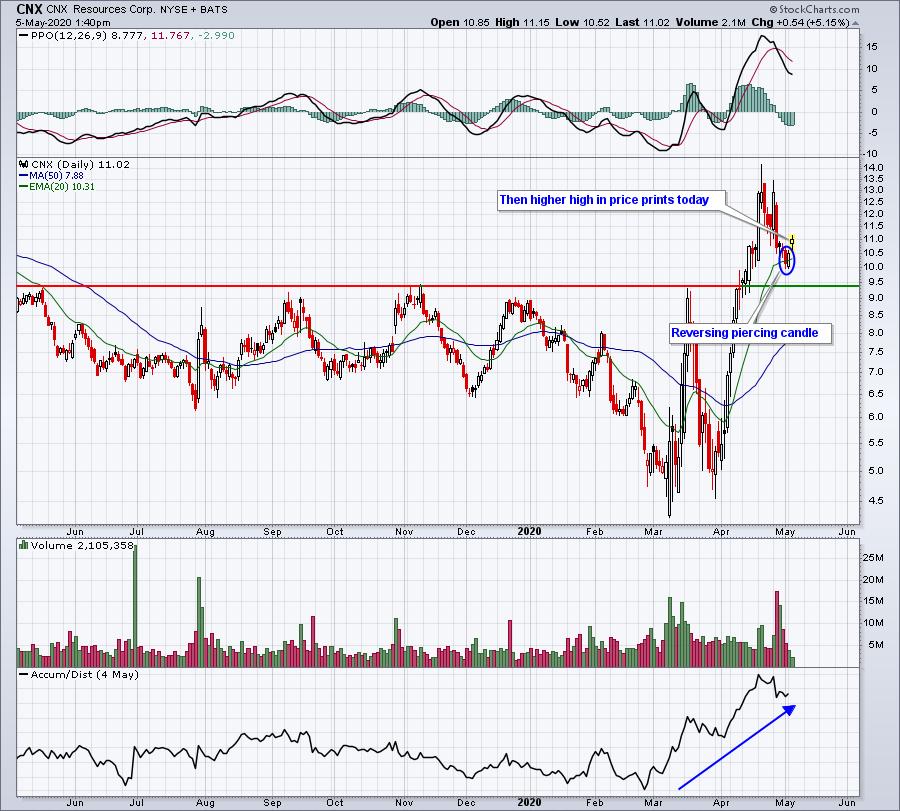
CNX:
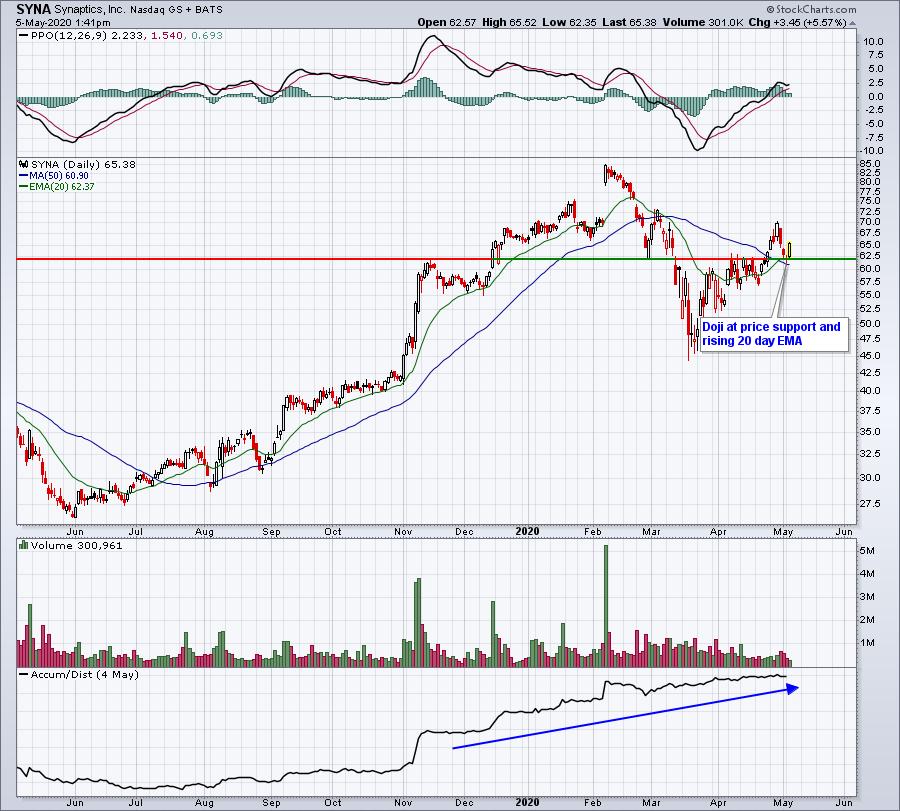
SYNA:
MPWR:
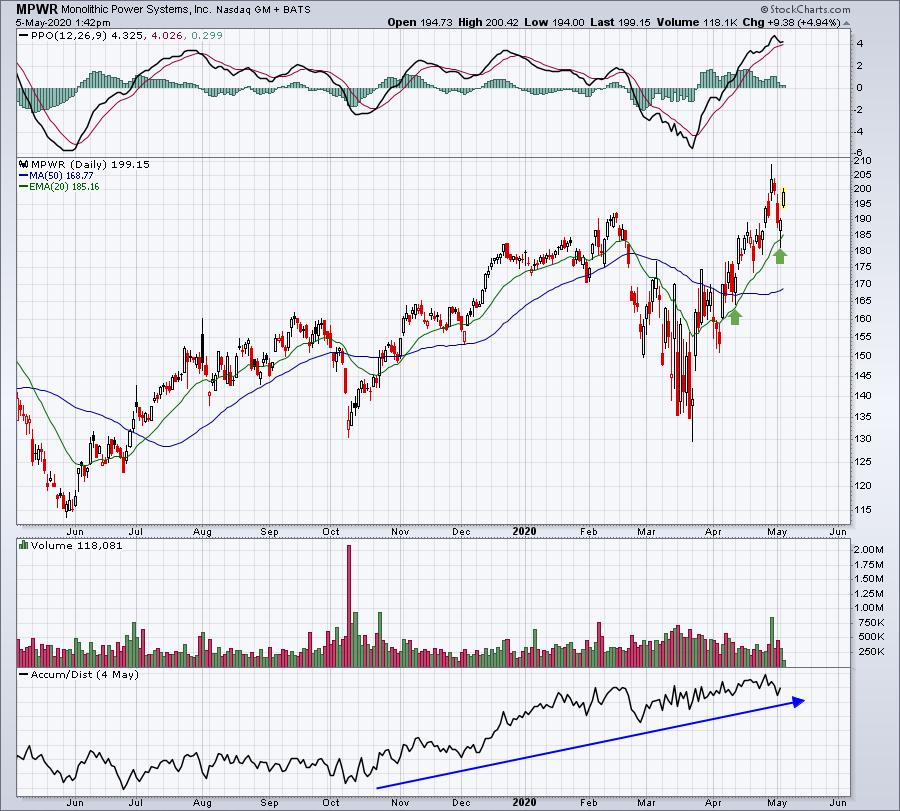
All three of these stocks have the following common characteristics:
(1) On their most recent price high, all PPOs were above the centerline (indicative of bullish momentum) and also at a high
(2) All pulled back to test rising 20 day EMAs
(3) All show solid accumulation/distribution lines
(4) All printed reversing candlesticks after first trading beneath their 20 day EMAs on an intraday basis
Earnings Reports
Here are the key earnings reports for today and tomorrow, featuring stocks with market caps of more than $10 billion. I also include a few select companies with market caps below $10 billion. Finally, any portfolio stocks (or active trade alerts) that will be reporting results are highlighted in BOLD. Beginning next week, I'll be placing an asterisk (*) next to stocks that are showing excellent relative strength and accumulation/distribution lines heading into their respective earnings report. In my judgment, I'd expect strong results and guidance, although correctly predicting which way a stock might gap after an earnings report is much more difficult. If you decide to hold a stock into earnings, please understand the significant short-term risk that you are taking. For this week's earnings reports, you should check out our "Q1 Earnings" webinar, where I detailed in two separate ChartLists those stocks where I'd look for good and bad quarterly earnings results. Please be sure to check for earnings dates for any companies you own or are considering owning:
Tuesday, May 5:
DIS, D, REGN, ITW, ATVI, NEM, LHX, TRI, DD, EA, SBAC, ALL, MELI, SYY, SU, KLAC, RSG, VRSK, PRU, EQR, SLF, MTCH, INCY, TT, MPC, TDG, AME, MPLX, APTV, FCAU, ANET, OXY, LDOS, PEAK, XYL, EXPD, FMC, PINS, MLM, W, BKI, CTLT, PKI. Others less than $10 bil: DVA, WU, BYND, LITE, ENPH, PLNT, DVN, IOVA, EVBG, TRIP
Wednesday, May 6:
NVO, PYPL, CVS, TMUS, SHOP, ZTS, EQIX, GPN, GOLD, WM, AEP, MET, GM, SQ, ES, FNV, MFC, ALXN, FMS, AVB, WCN, ANSS, AWK, NTR, WELL, RNG, WPM, IAC, FTS, FTNT, ESS, FOXA, CDW, TWLO, VMC, ALNY, VIV, PXD, AMP, KKR, BIO, EVRG, CVNA, MAA, INVH, ATO, KL, GDDY, DISCA, EXAS, EXR, CTL, GPC, J, UDR. Others less than $10 bil: QGEN, LYFT, PTON, NBIX, SRPT, WYNN, CDAY, ETSY, AYX, ZNGA, AMED, QDEL, SEDG, WEN, GRUB, LVGO, WING, FIT
Economic Reports
April PMI services: 26.7 (actual) vs. 27.0 (estimate)
April ISM non-manufacturing services: 41.8 (actual) vs. 37.9 (estimate)
Happy trading!
Tom


