I review a lot of the Dow Jones industry indices, but one problem is that you cannot trade an index. Naturally, I receive plenty of questions like "how can I benefit from semiconductors if the Dow Jones U.S. Semiconductor Index ($DJUSSC) is breaking out? Obviously, one way would be to trade individual stocks within the industry. But then what happens if I'm right about the DJUSSC going higher, but as fate would have it, I pick the wrong stock?
The good news is that there are some Exchange-traded funds (ETFs) that mimic an index. For instance, the SPDR S&P 500 ETF (SPY) is designed to mimic the S&P 500 index ($SPX). But not every index has an ETF designed to track it. So what do we do in that case?.
Before we get into that, let's simply review a chart of the Dow Jones U.S. Biotechnology Index ($DJUSBT):
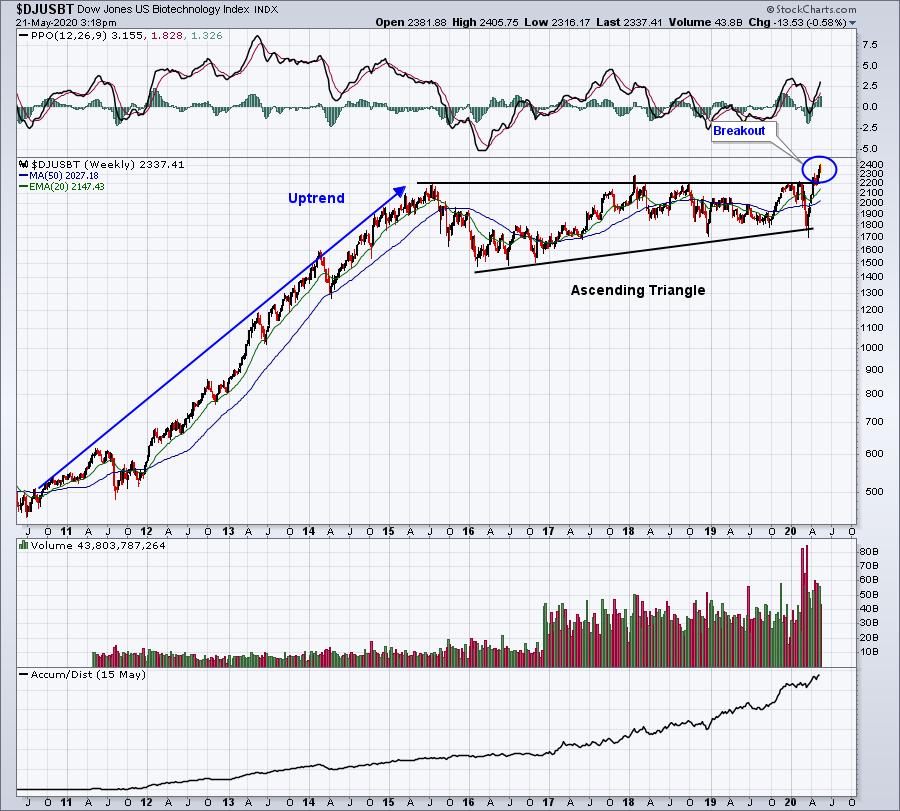
That's a nice breakout of a long-term consolidation pattern and is one reason that I believe biotechs are a must-own industry group. But you can't buy the index, so what do you do?
Well, there are several biotech ETF choices with two of the most popular being the IBB and XBI. The former (IBB) more heavily weights several large cap biotechs, while the latter (XBI) is more diversified and includes a much larger number of biotech stocks that comprise smaller percentages of the ETF individually.
The tool that I would use to determine whether either ETF is a good choice to track the DJUSBT would be the correlation coefficient. For instance, below are the charts of the IBB and XBI, with the correlation coefficient below each price chart. If an ETF does a good job of tracking an index, we should see the correlation coefficient at or very near +1. Any significant variances would be represented by corresponding drops in the correlation. Here are those two charts:
IBB:

XBI:

Based upon the last 10 years, I'd say the IBB has the better chance to track the DJUSBT's current breakout. We've seen multiple times where the XBI's correlation drops well below (red circles) the 0.75 to 1.00 positive correlation range (blue-shaded areas). That doesn't tell us whether the IBB or the XBI will perform better, it simply tells us that if we want to perform close to the DJUSBT, we'd probably rather own the IBB.
Tomorrow morning, we are opening up our WebinAR (WAR) Room to the public. It'll be 100% free and you'll be sent room instructions if you're a free subscriber to our EB Digest newsletter, published 3x per week on Mondays, Wednesdays, and Fridays. Tomorrow's EB Digest will provide room instructions so that you can join me at 10:00am ET. If you can't attend LIVE, we'll make sure that we send you a recording. CLICK HERE to sign up for our newsletter and to register! The topic for tomorrow, "Scanning our ChartLists" will demonstrate how we do our homework and then use the awesome tools and features here at StockCharts.com to uncover excellent trading ideas. I hope you can make it!
Happy trading!
Tom


