During the midst of the financial blow in March due to the pandemic, I realized that not all stock selloffs were created equal. While most stocks moved lower at the open, many were being bought, or accumulated, throughout the trading day. It was at that point that I ditched the RSI on my charts and added the accumulation/distribution line (AD line). I use it as a "secondary" indicator, so it's not as important to me as price and volume, which are my primary indicators, but what a difference it has made for me and our EarningsBeats.com community! The AD line honestly provided one of the most important technical signals of 2020. It helped me to realize early on in this pandemic that our major indices were moving lower due to opening gaps, not due to intraday selling/distribution. That was a very important distinction. During the 2008 financial crisis, most of the selling was intraday - 84% of it based on my calculations. Only 16% came from opening gaps. The big drop in 2020 saw roughly 100% of the drop at the open as media-induced selling engulfed Wall Street. The panic was all at the opening bell.
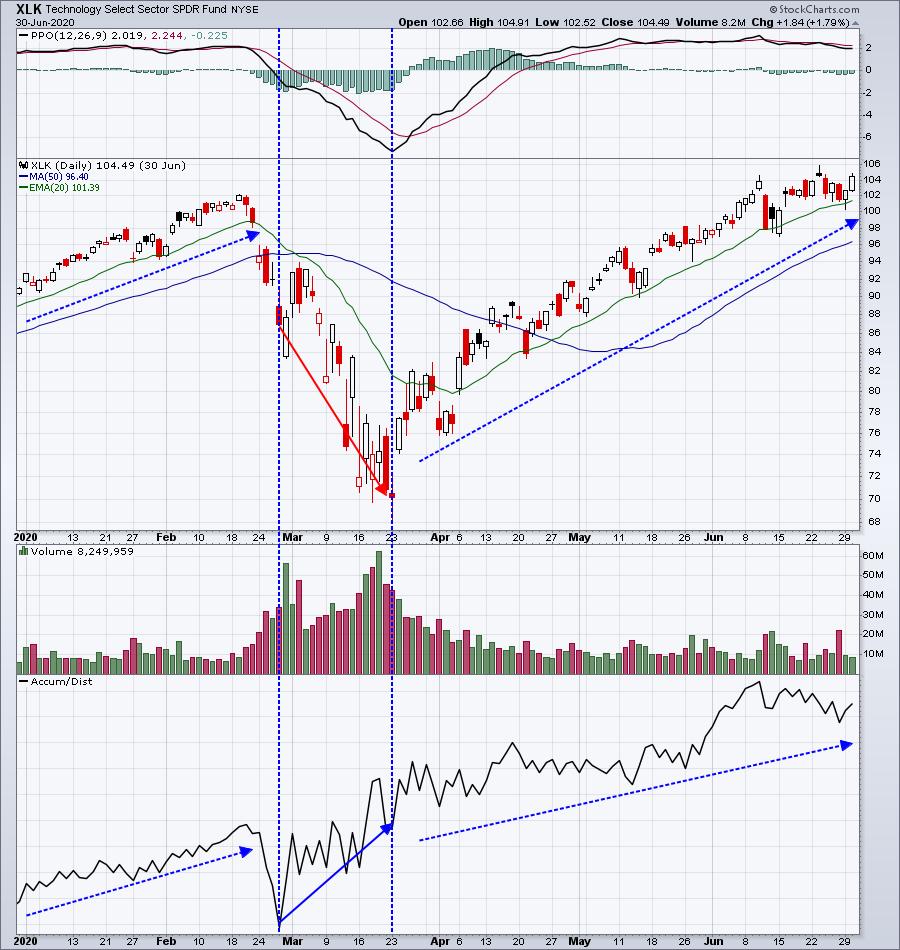
That was a MAJOR clue that institutions were not selling. Rather, they were rotating. They knew early on that this pandemic would not lead to a total market meltdown. But there would clearly be winners and losers. Airlines ($DJUSAR) would be crushed, but many technology (XLK) names would flourish. You could see it in the AD lines at the sector level. Check out the XLK and $DJUSAR during the first six months of 2020:
Technology (XLK):
Airlines ($DJUSAR):
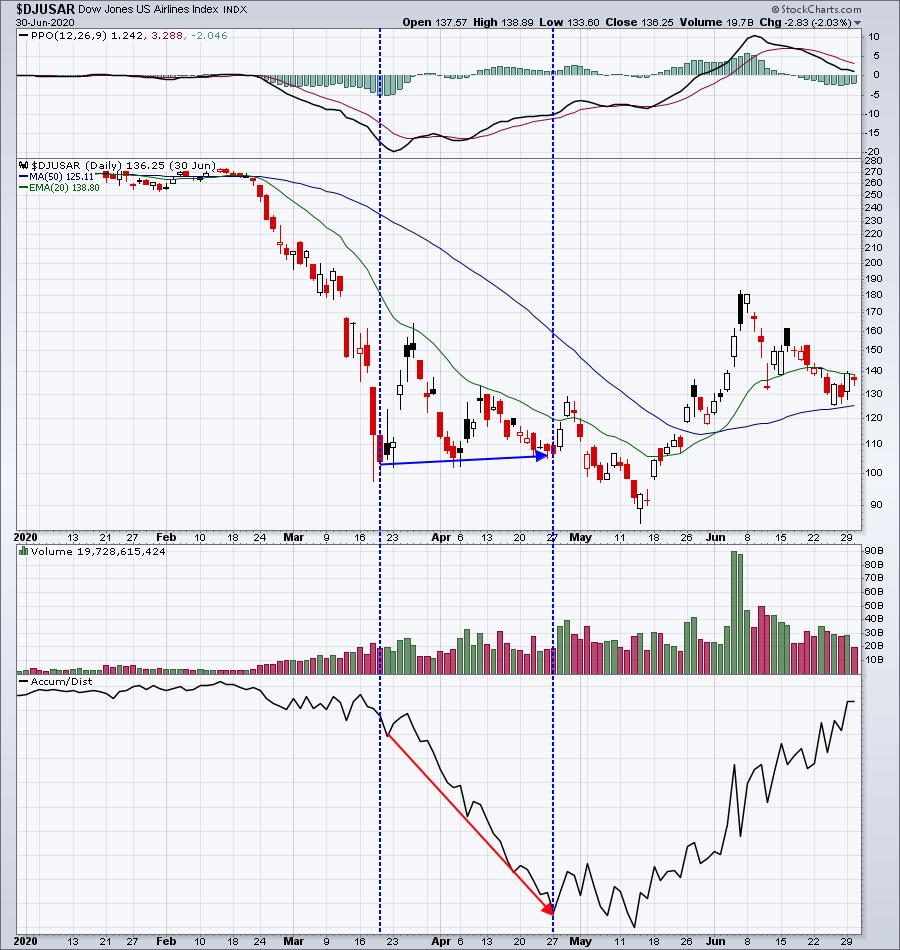
I want you to focus on the action between the two vertical blue-dotted lines on both charts. Do you notice all the "hollow" candles on the XLK chart and all the "filled" candles on the DJUSAR chart? A hollow candle means a closing price above the opening price (accumulation). A filled candle represents a closing price beneath the opening price (distribution). During the technology (XLK) "selloff", pure panic led to opening moves lower, but institutions were gladly buying from anyone wanting to sell, creating those hollow (bullish) candles. However, airlines ($DJUSAR) were completely opposite. During the period highlighted, airlines actually closed slightly higher than where they began, but check out that AD line! It crashed! Airlines were being propped up at the opening bell, providing false hope, only to be crushed during the trading day as institutions unloaded billions of shares.
If you weren't following the AD line and not using candlestick charts, it was much more difficult to see what was actually taking place.
Given that backdrop, now let's move on to what the AD line is telling us about biotechs ($DJUSBT) right now. Before we do that, though, check out the long-term, "Big Picture", weekly chart of the DJUSBT:

A major breakout to an all-time high followed a 5 year consolidation period. That is typically a very bullish development. Normal pullbacks after such breakouts tend to successfully test the rising 20 week EMA. We saw that multiple times (green arrows) during the major advance from 2012 through 2015. Moving averages are very important support during trending markets, but offer little support during trendless markets. If you review the long-term ascending triangle, you'll see many, many moving average failures as support/resistance. They simply don't work. In trending markets, however, you must be aware of these critical moving averages. I follow the 20 period and 50 period moving averages most closely.
So please understand that I already have a bullish bias on biotechs because of this long-term picture. Now let's turn our attention to the IBB (ETF that tracks biotechs) and check out the AD lines on 10 minute, hourly, and daily charts:
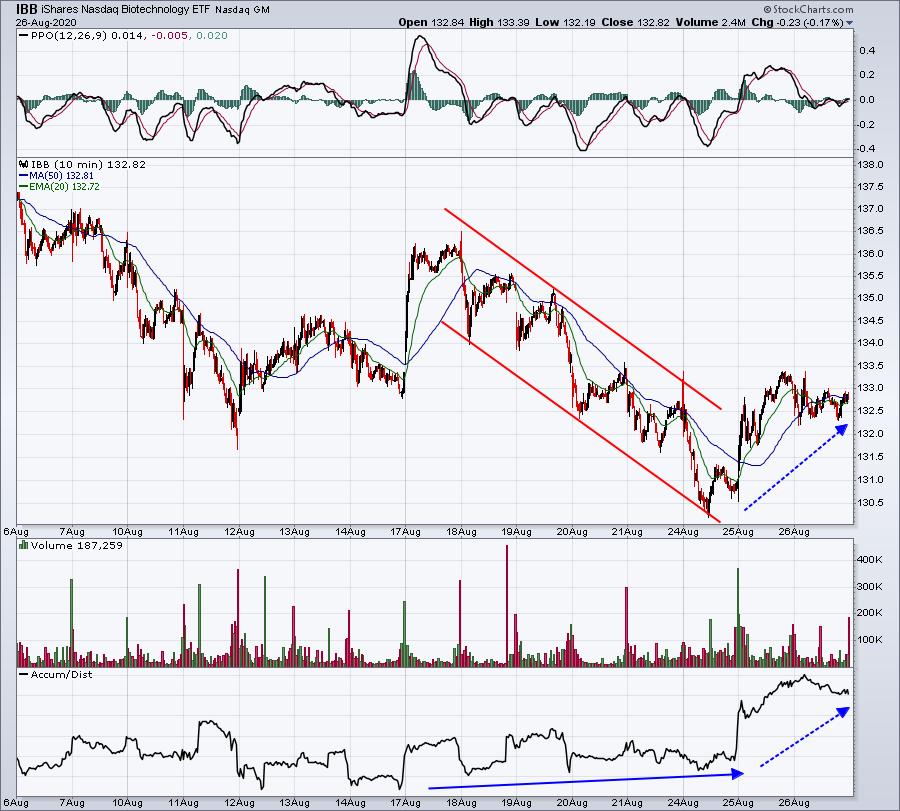
IBB - 15 day 10 minute chart:
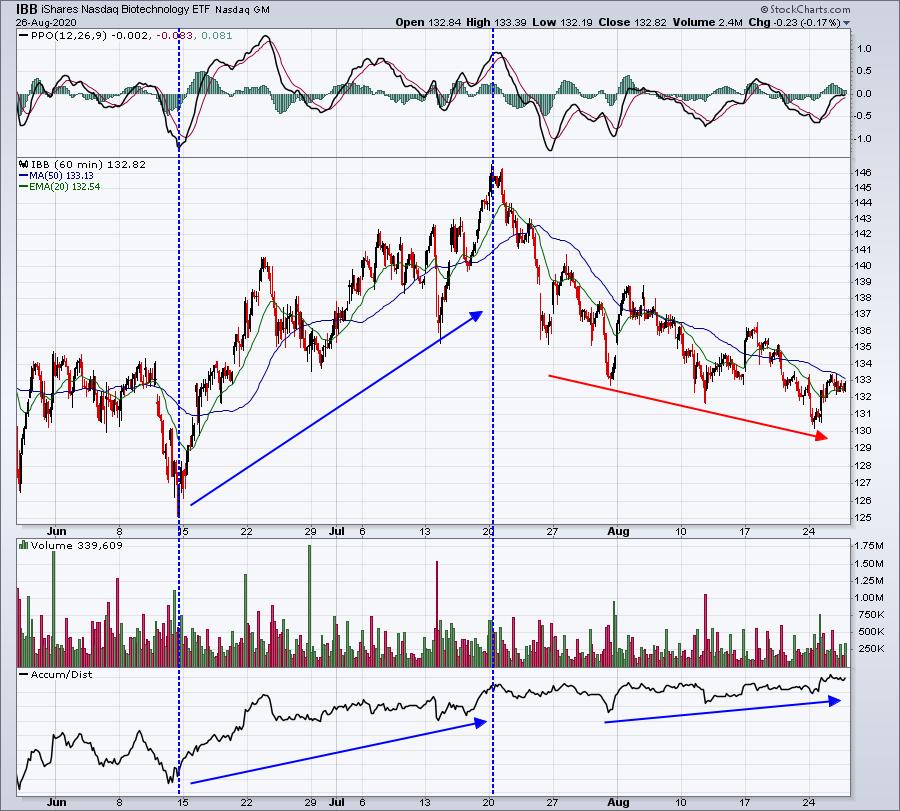
IBB - 3 months 60 minute chart:
IBB - 1 year daily chart:
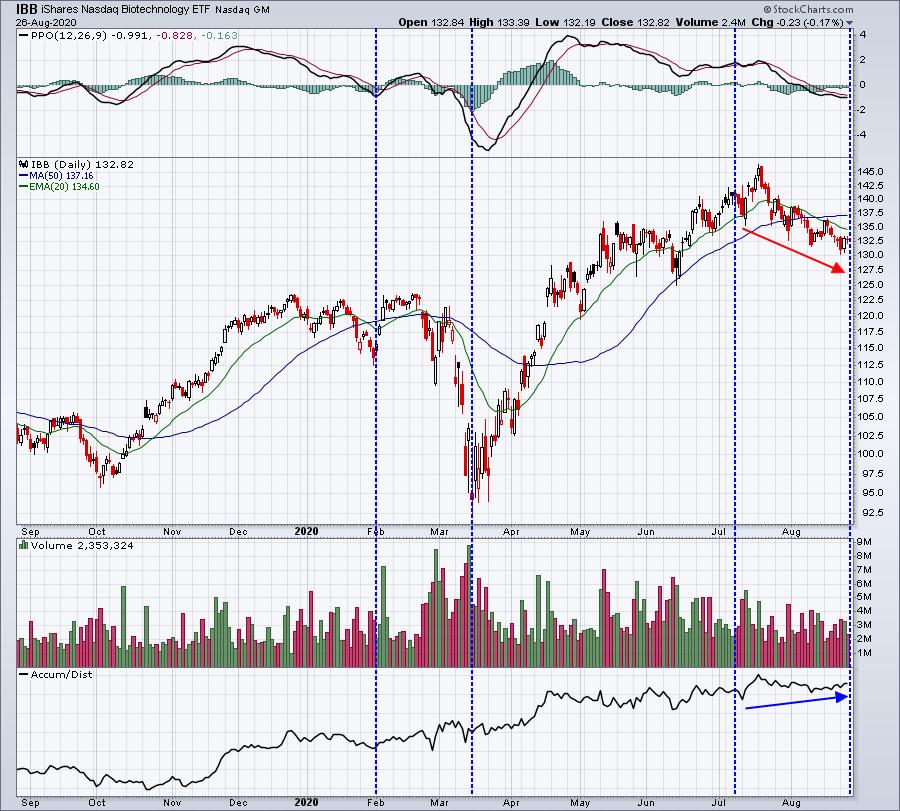
In each of these timeframes, I'd argue that biotechs are being accumulated, despite the falling stock price. That corroborates my "Big Picture" view that biotechs are in a long-term uptrend and represent a great investing/trading opportunity. (Disclosure: I own IBB shares)
There are never any guarantees in the stock market. NEVER. But I use technical analysis to help me manage risk, not to provide guarantees. Given everything shared in this article, I love the reward to risk in the biotech group right now. It may prove to be a dud of a trade, but if so, I can live with it.
If you've enjoyed this article, I'd like to ask you to do two things. First, scroll down and be sure to subscribe to my Trading Places blog in the area provided. It's very simple. Just provide your email address and click "Subscribe". Then the moment I publish a new article, it'll be sent directly to the email address you provide. Second, I'd love to have you become part of our EarningsBeats.com community and learn more about our approach to the market. We have a completely FREE newsletter, EB Digest, that's published 3x per week - Mondays, Wednesdays, and Fridays. There's no credit card required and you can unsubscribe at any time. In Friday's edition, I'll provide you an individual stock that's showing tremendous accumulation, which I believe provides us a much better chance of a sustained advance. CLICK HERE to sign up!
Happy trading!
Tom


