Let me start with the fact that I'm as bullish as they come in the long-term, so everything written here is for short-term traders only. Many times the market ignores short-term sentiment warning signals, so please don't misconstrue anything I'm about to write as a guarantee. There's no such thing in the stock market. But I view technical analysis as a tool to help me manage risk. I believe the short-term risk is elevated for two reasons:
Positive Correlation Between VIX and S&P 500
I wrote about this in my ChartWatchers article last weekend, but it's grown much worse now. The correlation between the Volatility Index ($VIX) and S&P 500 has never been more positive in the past 5 years. Why is that significant? Well, you first have to understand that fear, which is essentially what the VIX measures, generally moves in inverse fashion to the S&P 500. When stocks sell off, fear grows. When stocks rise, fear dissipates. That's the historical relationship and it's common sense. When the VIX begins to rise during a market rise, however, it's sending a message that the market is growing more and more fearful, or skeptical, of the rally. Bad news, or even just the start of some profit taking can escalate because of the increase in fear. Here's a chart to illustrate how this sentiment reading provides us a warning before actual selling begins:
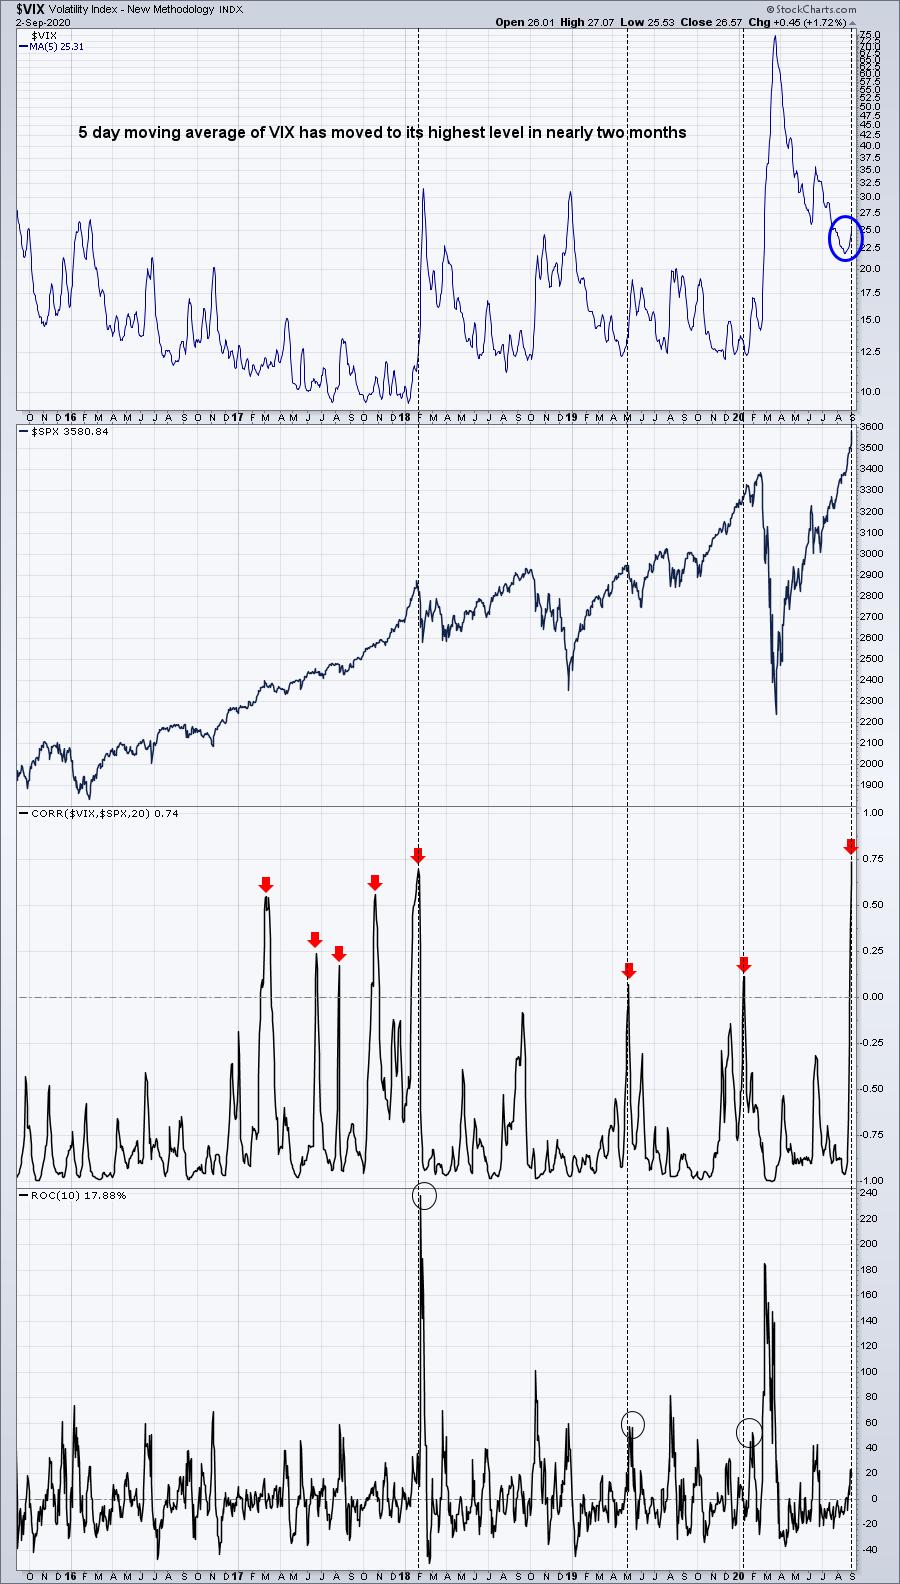
Over the past 5 years, we've seen a positive correlation between the VIX and S&P 500 on 7 previous occasions. We saw at least a small pull back on 6 of those previous 7 readings. The current positive correlation is at .74, the largest positive correlation over these 5 years. I don't know if that matters or not, but I suppose we're about to find out.
Put Call Ratio Hits Extreme Level
Everyone is buying calls. The 5 day moving average of the equity put call ratio ($CPCE) has fallen to .41. That means that .41 puts are bought for every call. The normal reading is probably something closer to .65. When the stock market is in "melt up" mode and calls are being scooped up like never before, guess who's on the other side of those trades? Yep, market makers. They can protect themselves by selling the calls and buying the stock (covered call strategy), but they make a TON of money if the market can flip and sellers gain control. How? Well, they sell their longs for profit, join in the short selling parade (making money there too), and then profit for a third time as value for all those calls that they sold disintegrates into thin air. It's like magic. Let me give you a sense of just how bullish traders have been by viewing this 5 day moving average of the CPCE:

The CPCE is back at the early-June level, which was its lowest CPCE reading in the past 5 years. Do you recall how that ended for the S&P 500? If not, let me remind you with an S&P 500 chart:

Now before you go off screaming "A BEAR MARKET IS COMING!", look at what happened. We saw a period of selling and then the bull market resumed. As I said earlier, I'm very bullish. But, as a short-term trader, I never ignore the short-term sentiment warnings. It's how market makers walk off with a boatload of our money.
Let me give you one more BONUS warning.
History Favors Selling In September
Since 1950, here are the S&P 500's annualized returns for the first two days of September vs. the balance of the month:
September 1-2: +42.24% (64.9% of days during this period end higher)
September 3-30: -8.08% (51.6% of days during this period end higher)
Yesterday was September 2nd. September, like other months, benefits from new money coming into the market from retirement funds (think pensions, 401ks, etc.) during the first couple days of the month. After that, however, it's historically been an uphill climb for U.S. equities. I want to make one point clear. The -8.08% is an average annualized return, not an absolute return. So don't expect September to produce an 8% selloff - it may happen, but that is NOT what this is telling us. Rather, it's simply saying that the tendency during September is to see more bearish action.
The point of this entire article is that we need to be aware of our market environment and understand the increased risk. I always use the analogy of storm clouds. They're on the horizon, but it doesn't mean we'll see a hurricane. But to go outside without an umbrella probably wouldn't be the wisest choice.
Go get your umbrella.
Please join me at EarningsBeats.com by signing up for our free EB Digest newsletter. It's published 3 times per week on Mondays, Wednesdays, and Fridays, highlighting earnings and how to trade gaps resulting from those earnings, relative strength/weakness, accumulation/distribution and how to zero in on high quality trades, etc. CLICK HERE to join our community of thousands of traders! While you're there, be sure to check out our portfolio results. We practice what we preach!
Happy trading!
Tom


