Happy Valentine's Day!
The Volatility Index ($VIX) is one of the sentiment indicators that I pay close attention to. So many sentiment readings deal with "feelings", which I tend to discard. I want to know what is actually going on with THE MONEY. Don't tell me how you "feel" about the market, tell me what you're doing with your money. There's a difference between "feeling" like buying a new house and getting pre-approved for a mortgage. Actions always speak louder than words.
The VIX is an actual calculation (rather complicated I might add) that is essentially based off of the pricing of options. When fear is in the air and market volatility expands, option premiums shoot higher. The VIX is a measure of that "expected volatility." When the VIX is high and falling, Wall Street is climbing that wall of worry. On Friday, the VIX fell to 19.97 on the close, the first time we've seen the VIX close below 20 since the pandemic began and fear exploded:
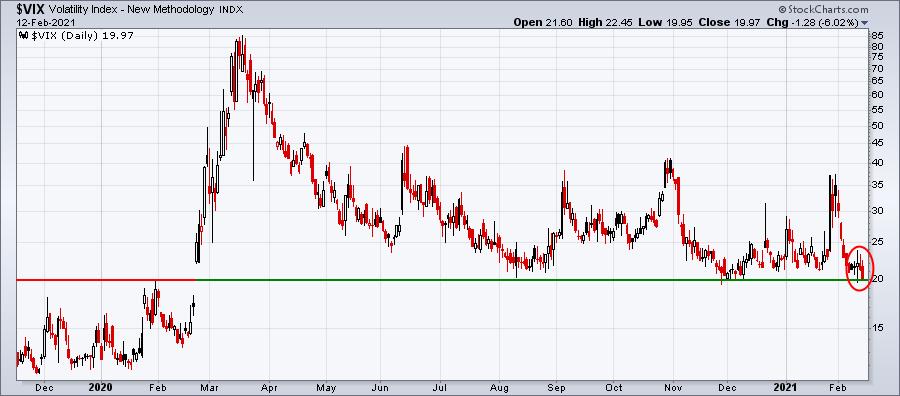
When the VIX remains elevated, it tells us that fear is in the air and we need to remain on alert. As the VIX falls and the market grows more and more complacent, volatility shuts down and that's typically a very bad thing for those who are bearish. A boring market becomes a very bullish market.
I decided to go back over the past 10 years, during an overall bullish market environment, to see the history of short-term spikes in the VIX above 30 with subsequent drops back below 20. What is the effect of shrinking pessimism and fear? What I found - in every case thus far - is that the VIX falling below 20, after a bout of fear, results in significantly higher prices one month later. It's happened 7 times prior to Friday and here are the results:
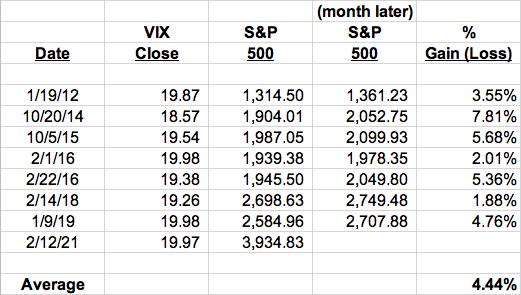
The first S&P 500 column represents the index value on the day the VIX closes below 20. The next column shows the S&P 500 index value one month later. The worst performance was 1.88% in 2018, while the best was nearly 8% in 2014. That average one-month gain is 4.44%.
We have to deal with February options expiration in the very near-term, but otherwise this VIX signal is suggesting we have more gains ahead. The lowest subsequent one-month gain of 1.88% would push the S&P 500 above 4000 for the first time in history. So unless history fails to repeat itself, get ready for 4000 on the S&P 500. It's right around the corner.
The action in the VIX is just one more reason to remain bullish U.S. equities. It's also another reason to be very excited as we approach our next portfolio DRAFT DAY, which will be Sunday, February 21 at 7:00pm ET. Our 3 high-flying portfolios - Model, Aggressive, and Strong AD - have returned staggering returns this quarter of 32.55%, 42.45%, and 42.78%, respectively, while the S&P 500 has gained 9.85%. Our Model Portfolio has now outperformed the S&P 500 in 8 out of 9 quarters since we introduced it in 2018. On Monday, February 15th, we'll have an "open to the public" Sneak Preview event to discuss our portfolios and I'll even drop a few names that I'm considering for inclusion in next quarter's portfolios. The Sneak Preview is a free event. If you'd like more information, CLICK HERE!
Happy trading!
Tom


