Why am I always so bullish? I'm asked this question in many different ways, but I'm very happy to explain my stance - and it's quite simple. Because the stock market goes up a WHOLE LOT MORE than it goes down. Instead of constantly citing all the negatives and trying to predict 42 of the next 3 secular bear markets, try going long. It works!
Let me point out a few facts about the S&P 500 (since 1950) based on all of my historical work:
- 53.48% of all trading days have ended higher
- 60.42% of all calendar months have ended higher
- 74.65% of all calendar years have ended higher
Notice that as we extend the period - from days to months to years - that the percentages strongly favor the bulls. Is today the only time that we've ever had worries about the stock market? Of course not. We've had worries in all shapes and sizes over the past 7 decades, some much worse than others. But through it all, the stock market goes higher much more often than not.
We do go through super-cycles in the stock market, however, and it's very important to recognize them. We're currently in a secular bull market and it's quite apparent when you look at a 100-year S&P 500 monthly chart:
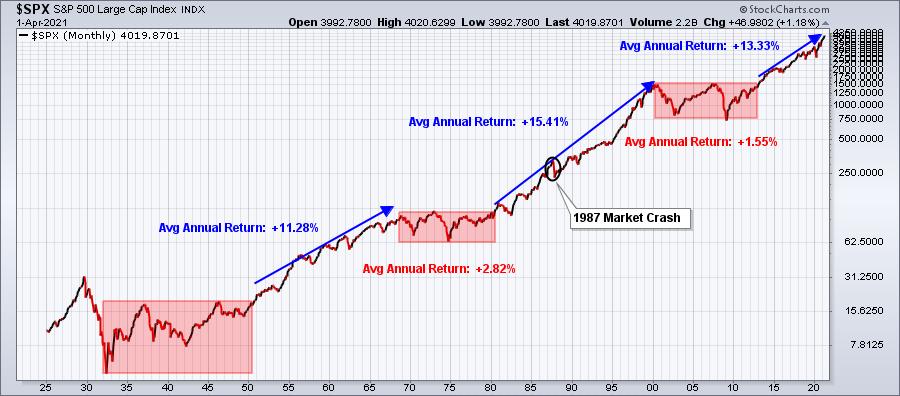
The red-shaded areas represent secular bear markets. The blue areas represent secular bull markets and we MUST be able to recognize the difference. The latter - the secular bull markets - tend to ignore over time what we perceive to be horrific events. The 1987 market crash occurred during a secular bull market in the 1980s and 1990s. It's a blip on the chart now. Likewise, the trade war and especially the COVID pandemic created unprecedented fear and anguish. It's become a blip as well.
We're going higher. You can fight it, trying to call every major top that never materializes, or you can embrace it.
Secular bear markets have one common characteristic technically. Weakness is so strong and lasts so long that monthly PPOs turn negative. When the monthly PPO turns negative, get out of the stock market - or at least begin to seriously consider your alternatives. That's when it would be very difficult to be bullish. You might think that you've missed the worst of the selling if you wait until a monthly PPO turns negative, but that's not the case. First, let's look at a 25-year monthly chart of the S&P 500, this time with a monthly PPO on it, to see how the PPO centerline crossover works:
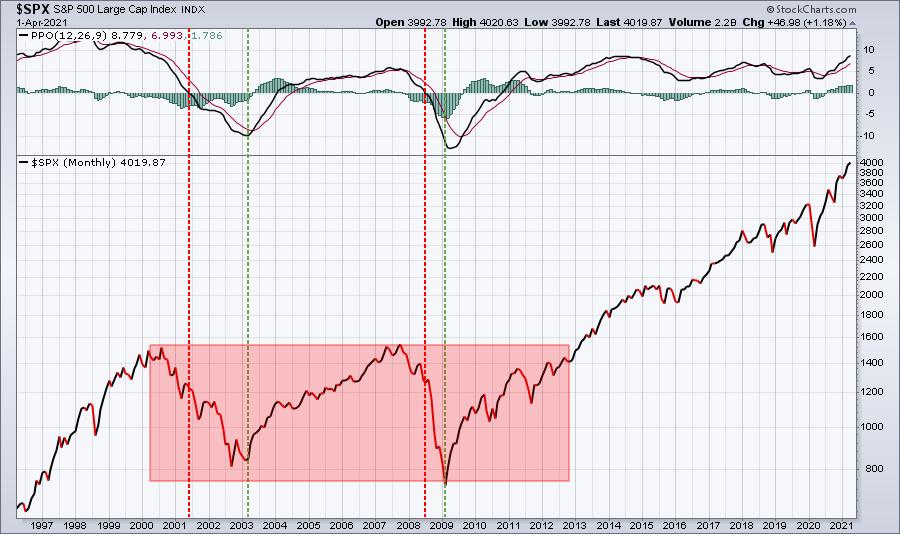
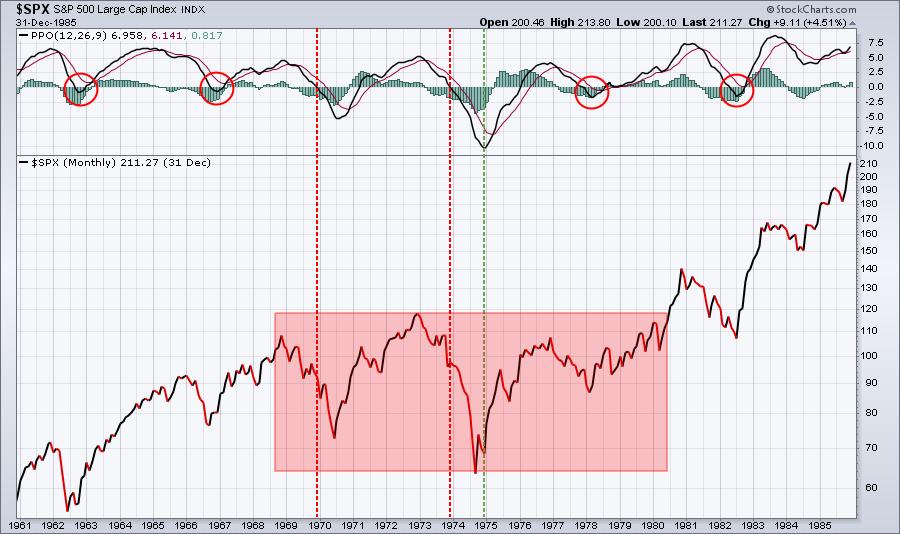
The red-dotted line highlights the monthly PPO centerline cross into negative territory. The green-dotted line marks when that monthly PPO reaches -10, a level that historically has been synonymous with market bottoms. For another look at a secular bear market, let's go back and highlight how the 1970s played out:
A couple things:
First, unlike the last 25 years, the 1960s and 1970s provided a few head fakes where we saw the monthly PPO turn negative temporarily (red circles). So while a secular bear market requires a monthly PPO to turn negative, a negative monthly PPO does NOT always result in a secular bear market. But my takeaway here is that if the monthly PPO does turn negative, THAT is the time to start discussing the dreaded secular bear market and looking at intermarket relationships, etc., to attempt to confirm what the monthly PPOs are telling us.
The second important takeaway is that you don't want to wait until the monthly PPO turns positive to fully invest again. Since 1950, secular bear markets have seen monthly PPOs reach minus-10 in 3 out of 4 instances. Typically, we want to see a selling crescendo. The monthly PPO level of -10 is a very good historical indication of a crescendo being reached or at least rapidly approaching.
Please keep in mind that during "cyclical" (short-term) bear markets, we don't generally see monthly PPOs drop below zero. As an example, during the Q4 2018 trade war selloff, the monthly PPO fell to the 4-5 level. During the pandemic, the monthly PPO fell to the 3-4 level.
Every stock market period is different and needs to be evaluated separately. It's definitely not a one-size-fits-all. But the moral of the story here is that we don't need to try to call a bear market constantly. Ignore all of those who do....and follow the charts. A simple indicator like the monthly PPO will tell us much more than any analyst trying to predict the next crash. Since 1950, the S&P 500 has had two major tops. TWO! The first was in the early 1970s and the other was the dot-com bubble in 2000. That's it. Two major long-term tops in the past six decades.
Why do we keep trying to predict the third one without any technical confirmation whatsoever?
I write a 3x a week EB Digest newsletter that is completely free - no credit card required - that focuses on earnings, relative strength, etc. If you'd like to try it, CLICK HERE and simply enter your name and email address. I'm planning to feature an earnings-related trade setup on Monday morning, so be sure to sign up this weekend and receive the setup before the market opens on Monday!
Happy trading!
Tom


