A great post-earnings set up needs to check several boxes. The first box I need to check is the "beat revenue and earnings estimates" box, followed closely by the "raised guidance" box. When a company beats top and bottom line estimates and raises guidance, it results in Wall Street firms having to revalue those companies. Future earnings and future earnings growth assumptions change, which should result in higher valuations. That should make good common sense. Of course, the stock market rarely operates in the short-term based on common sense. That's exactly where opportunities arise. Great companies can sometimes report great results and still see a decline. Why? Because those great results have already been baked into the stock price before earnings are released.
This is the reason why I maintain our flagship ChartList, our Strong Earnings ChartList (SECL). Our SECL features only companies that have beaten both revenue and EPS estimates in their most recent quarter. As a company approaches its earnings report, if it beat both top and bottom line estimates in its prior quarter and it's on our SECL, it gets removed prior to that upcoming next report. There's only one way back on the list - it has to beat both revenue and EPS estimates again. There are also other filters like average daily volume to make sure all stocks on the SECL are liquid. I also use my judgment to remove stocks that are not technically sound or belong to a group that's not technically sound. I believe our SECL is the best Watch List anywhere to trade off of. Nearly every stock in our Model, Aggressive, Income, and Strong AD portfolios has come from our SECL. Since inception, our portfolios have crushed the benchmark S&P 500.
I know it's very early in earnings season, but I've already seen a few dozen really solid earnings reports. But which have stood out above the rest? Well, that's the purpose of this article. Here's my short list of the best Q2 earnings reports:
PepsiCo, Inc. (PEP)
Q2 Earnings Results:
- Revenues: $19.22 bil (actual) vs. $17.96 bil (estimate)
- EPS: $1.72 (actual) vs. $1.53 (estimate)
In addition, PEP raised its EPS guidance for 2021 from $5.94 to $6.20.
On this news, PEP broke out on an absolute basis and is threatening a relative breakout vs. its soft drink peers ($DJUSSD):
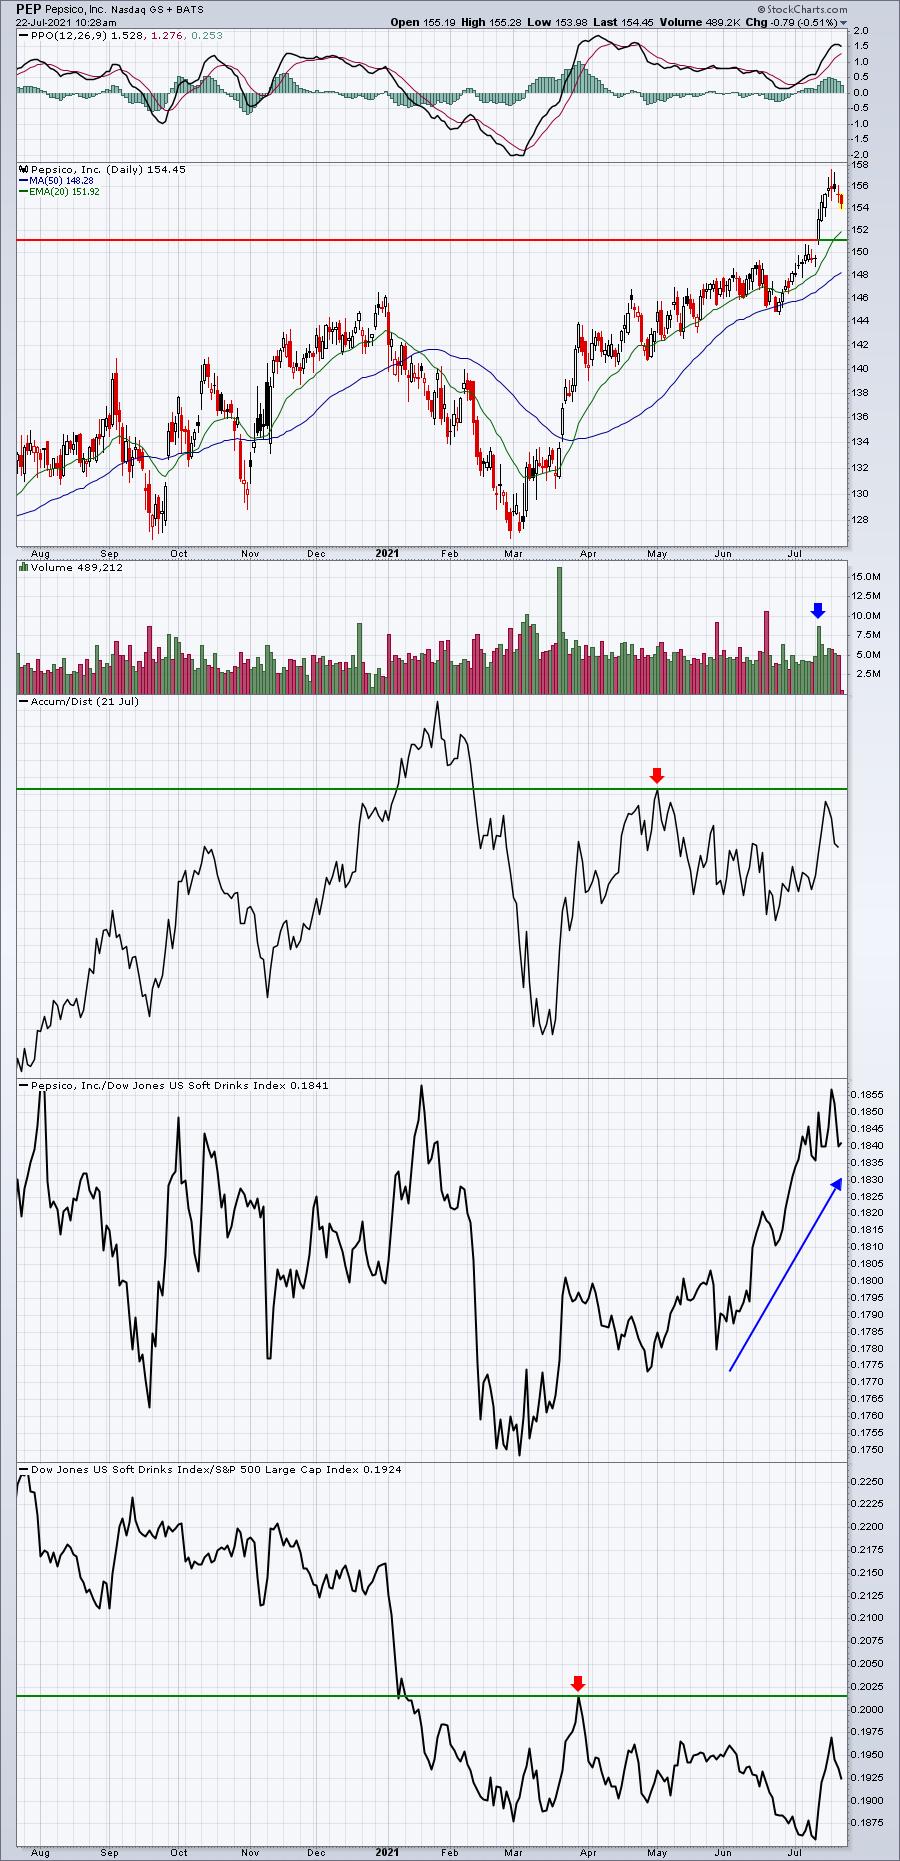
There's a bit of relative work to be done as PEP has established a relative triple top. Also, the AD line has improved, but could use another breakout indicative of Wall Street accumulation. But the numbers were sound and I believe will result in higher prices ahead for PEP.
Crocs, Inc. (CROX)
Q2 Earnings Results:
- Revenues: $640.77 mil (actual) vs. $559.11 mil (estimate)
- EPS: $2.23 (actual) vs. $1.52 (estimate)
In addition, CROX indicated that its 2021 revenue growth would be in the 60% to 65% range, up from prior guidance of 40% to 50% growth.
The initial reaction to this morning's excellent quarterly report was what you might expect - a huge gap higher with a bit of selling after the open. Market makers are on the short side when there's an imbalance of buy orders, so we should generally look for intraday selling.
Nike (NKE) started off the frenzy in footwear stocks ($DJUSFT) when it reported blowout results. Today, we get further confirmation that the industry is doing just fine with the CROX results. Here's how CROX looks currently:
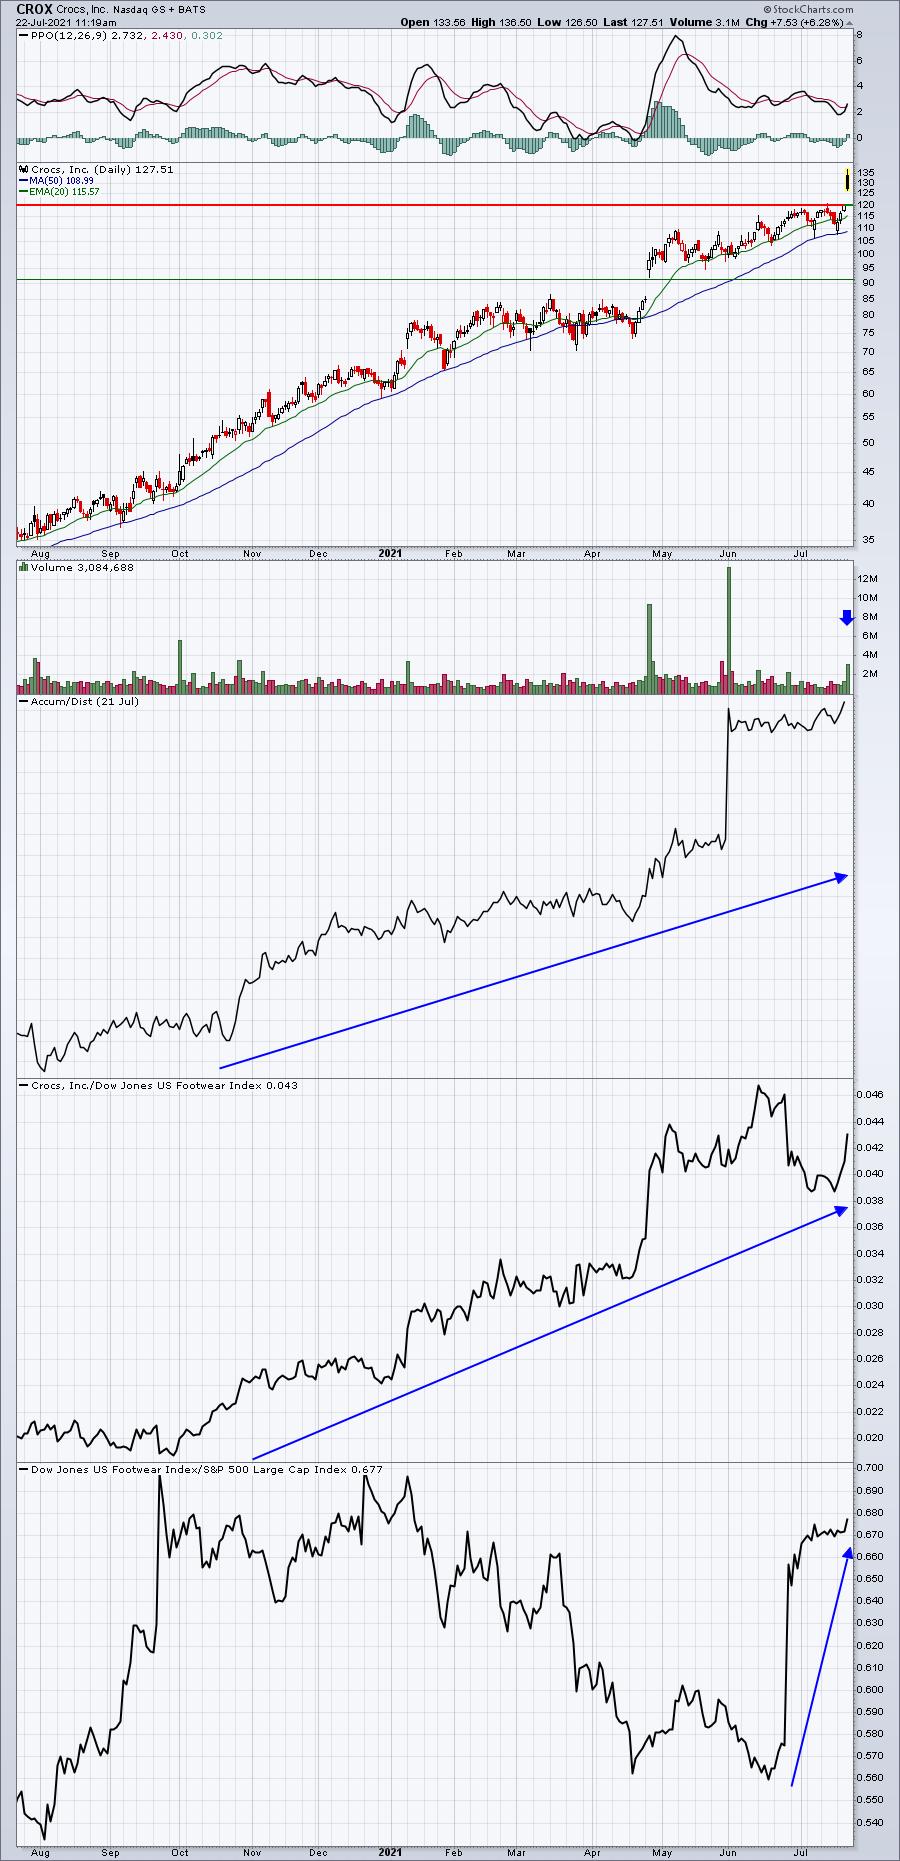
We're seeing a black candle print early today and the PPO negative divergence suggests we could see further selling ahead. This doesn't change the fundamental strength of this report one bit. But it could present us with a great opportunity for entry at some point over the next few days to few weeks. That's what I'm waiting for to trade.
HCA Healthcare, Inc. (HCA)
Q2 Earnings Results:
- Revenues: $14.44 bil (actual) vs. $13.61 bil (estimate)
- EPS: $4.37 (actual) vs. $3.16 (estimate)
In addition, HCA raised its 2021 revenue and EPS guidance. Its 2021 EPS guidance was raised from a range of $13.30-$14.30 to a new range of $16.30-$17.10. That's a hefty jump in earnings growth that'll likely require a re-evaluation of market cap. We've seen the start of that process with the initial earnings reaction:
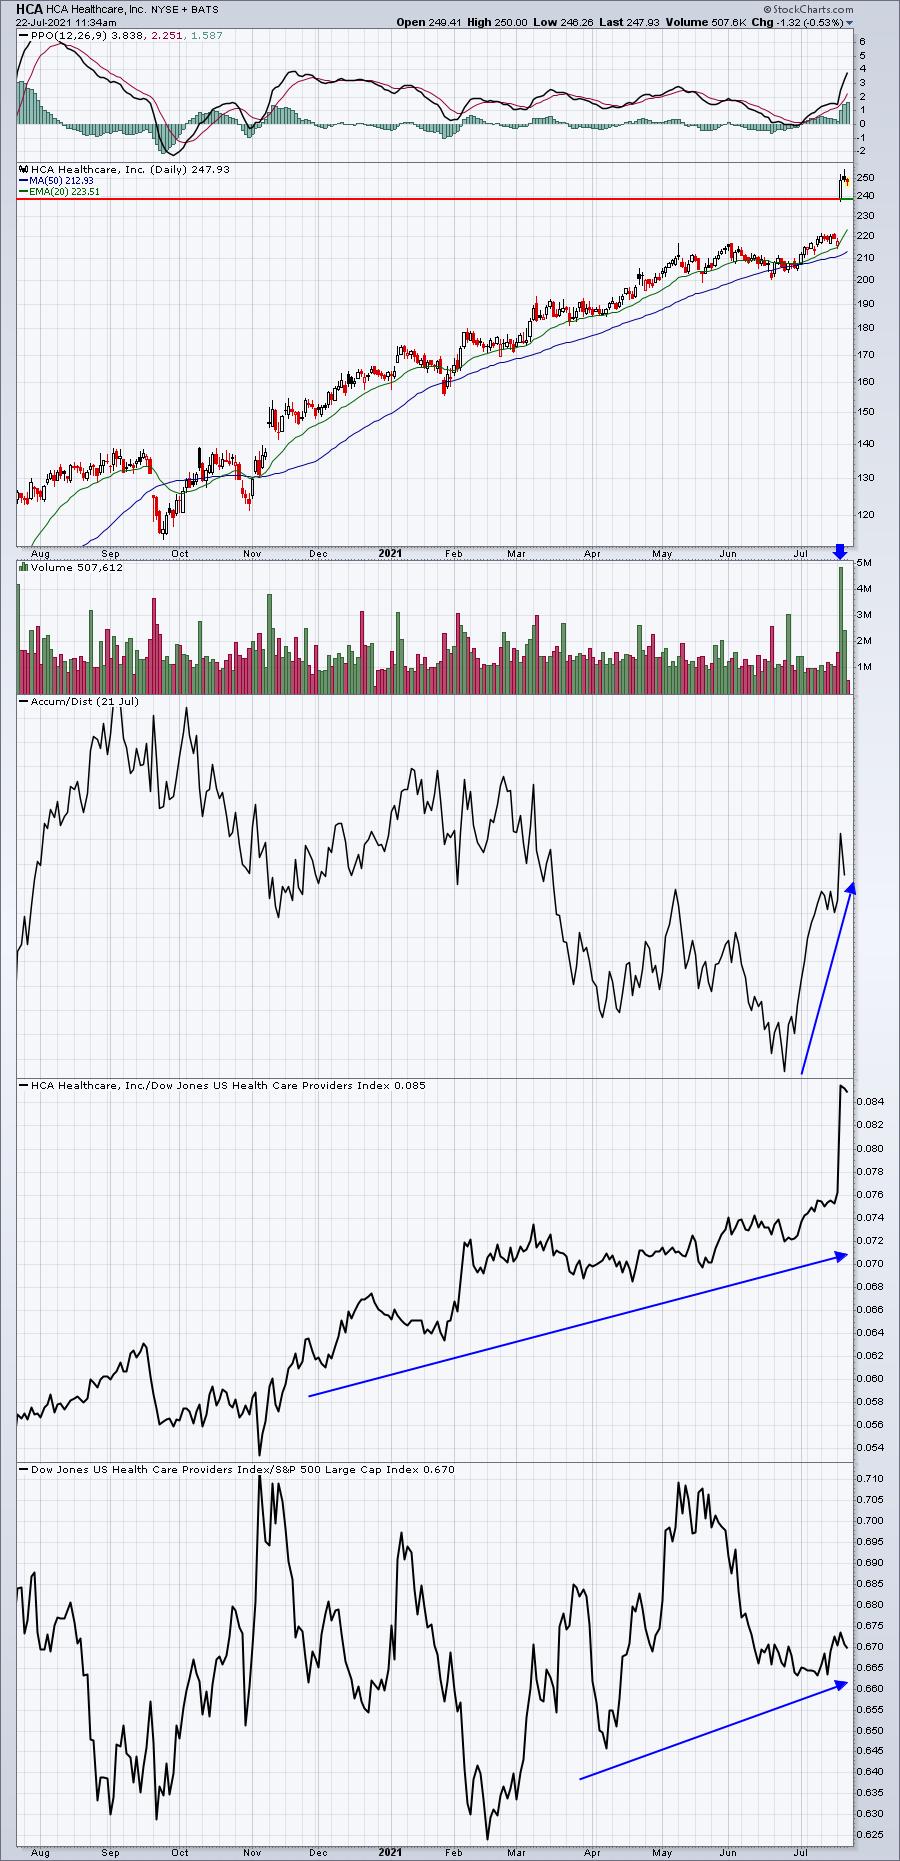
When a stock like HCA gaps higher and then continues moving higher throughout the session on massive volume, it's an indication to me that demand overwhelmed supply and that typically bodes well for further appreciation. Also, any return trip to the open after earnings, in this case 239.10, represents an excellent reward-to-risk entry point.
Looking ahead to the balance of earnings season, we'll see many, many more companies that report exceptionally strong results. Those companies will be organized in our Strong Earnings ChartList and we'll run scans against that ChartList throughout the next several weeks, providing excellent trading opportunities. If you'd like to become a 30-day trial member at EarningsBeats.com to take advantage of these opportunities, I have great news! Our 30-day trial is completely free and you can download our Strong Earnings ChartList (among other ChartLists) directly into your StockCharts.com account. If you're not a member at StockCharts, you'll still be able to view the charts. CLICK HERE to start your 30-day trial!
Also, in tomorrow's free EB Digest newsletter, I'll be highlighting a company that I expect to report absolutely BLOWOUT numbers next week. Relative strength has been exceptional and its AD line is at a new high as well, suggesting that Wall Street has been accumulating the stock ahead of its report. If you'd like to become a free subscriber (no credit card required) of our EB Digest newsletter, simply CLICK HERE and provide us your name and email address in the spaces provided. You can then see next week if I'm right about this upcoming blowout report.
Happy trading!
Tom


