News that a new COVID-19 variant has surfaced in South Africa spooked global equity markets on Friday. Was it an overreaction and an opportunity to buy some of your favorite stocks cheaper? Or is the start of a much deeper, panic-driven selloff. Unless you're a scientist with inside knowledge, I don't think it's possible to know. There are so many questions right now that haven't been adequately answered and may not be answered for several days or weeks. Among those questions would be (1) rate of transmissibility, (2) efficacy of current vaccines against the new variant, (3) the new variant's infection fatality rate (IFR), and so forth. Without this information, it's impossible to try to determine what steps countries around the globe may need to take.
When the delta variant was first studied, it was found to be much more contagious and now the World Health Organization (WHO) estimates that 99% of the world's COVID cases are the delta variant. The worst case obviously would be that this new variant is even more contagious and that vaccines are proven to be ineffective protecting against it. But if global markets continue to panic and selloff as they did on Friday and the new variant poses less risk than first thought, clearly a major global rally could follow.
So what do we do?
Well, rather than search media outlets looking for financial advice, which proved to be absolutely worthless during the height of the 2020 pandemic (remember the Great Depression 2.0 forecasts?), I'd suggest we focus instead on what Wall Street is doing with their money. What sectors and industries are performing poorly on a relative basis (suggesting more exposure to an extended selloff)? Also, which sectors and industries actually performed better during the day on Friday, which would impact their respective AD lines. If you recall, the AD lines were, in my opinion, the best technical indicator throughout 2020 as they helped us identify which areas were being accumulated vs. distributed during the pandemic.
So let's take that approach again as we analyze Friday's action.
It's Deja Vu All Over Again
When I looked at major index and sector performance on Friday, the ranking was nearly identical to the period from February 19, 2020 (market top before panicked selling began) through March 23, 2020 (subsequent low on the S&P 500).
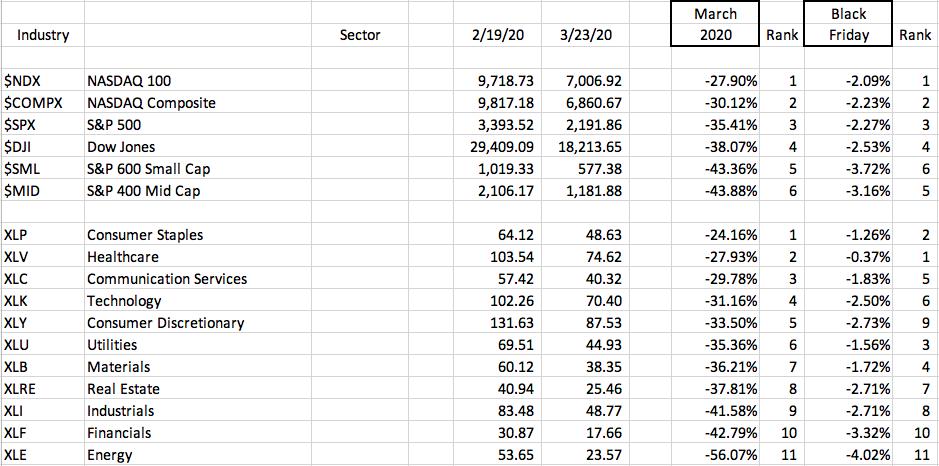
Energy (XLE), financials (XLF), industrials (XLI), and real estate (XLRE) were the bottom 4 sectors during the panicked selloff in 2020 and those 4 were again among the weakest on Friday. Meanwhile, consumer staples (XLP) and health care (XLV) were first and second (though reversed) both during the initial crisis in 2020 and again on Friday.
The order of performance on our major indices were almost identical.
Based on this quick analysis, if we continue to see a COVID-related selloff, I'd most definitely be expecting those bottom groups to continue to lead the selloff. If you have significant exposure in Friday's weakest sectors and industry groups, then I believe your risk is higher as we move into next week.
The Outliers
Not all industry groups conformed with last year's performance ranking. Those that remained relatively strong on Friday (key word here is relative as it wasn't a good day for many groups) and were also relatively strong back in March 2020 included the following industry groups:
- Gold mining ($DJUSPM): #1 in March 2020 and #2 on Friday, or 1 and 2 (out of 104 industry groups)
- Mining ($DJUSMG): 3 and 3
- Mobile telecom ($DJUSWC): 4 and 6
- Biotechnology ($DJUSBT): 8 and 1
- Toys ($DJUSTY): 9 and 4
These were the only 5 groups that were in the Top 10 in March 2020 and on Friday.
Then there's the flip side - those industry groups that were weak in both periods:
- Recreational Services ($DJUSRQ): 103 and 104
- Oil equipment & services ($DJUSOI): 101 and 96
- Coal ($DWCCOA): 100 and 98
- Airlines ($DJUSAR): 99 and 103
- Aerospace ($DJUSAS): 97 and 97
These were the industries that were in the Bottom 10 in both periods. I'd definitely avoid all of these groups in the very near-term until we get more clarity. It may mean you miss some upside, but steering clear will eliminate the significant risk that exists if this new COVID variant proves to be more problematic than the delta variant.
What About Accumulation/Distribution (AD Lines)?
We saw very weak futures overnight on Thursday and our major indices gapped down significantly. But where did Wall Street see opportunity to accumulate? Well, one way to gauge that is to compare Friday's closing price to its opening price. It makes common sense that a higher close means there were more buyers than sellers throughout the day. The opposite is true if the close was below the open.
I'll be honest. I wasn't expecting the results that we actually saw. For instance, energy (XLE) was clearly the worst performing sector on Friday, but it rallied strongly in the afternoon and its AD line neared a 3-month high:
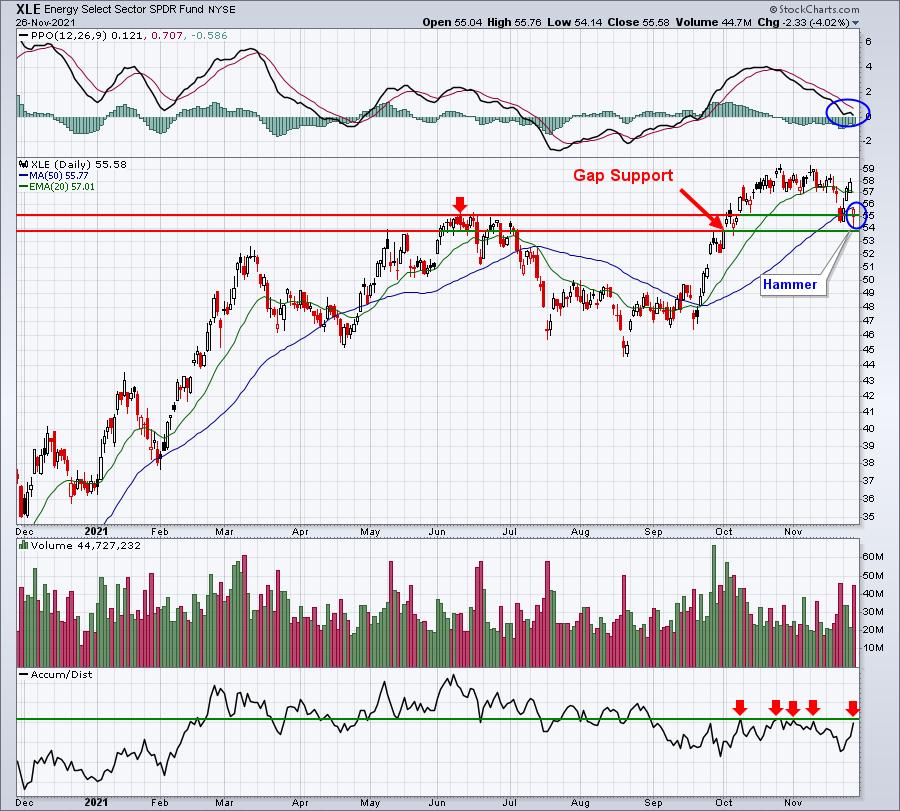
I have to say that energy behaved quite well during the day on Friday after a rather inauspicious start. The hammer at support, along with that rising AD line provides hope for a group that I said to avoid earlier in this article. We can't ignore that volume because it came on extremely heavy volume. Nearly 45 million shares changed hands, which wasn't the biggest volume day of the year. But we need to keep one thing in mind. The market closed early at 1pm ET on Friday. Had we been open a full day I believe the XLE may have traded its heaviest volume of the year. That, combined with the huge reversal, could signal a major bottom here. We'll have more days ahead that will provide us more clues, but based on my AD analysis, I'd turn bullish the group if I knew we weren't going to wake up to more negative COVID news on Monday morning. But that's the world we live in right now and the uncertainty is almost paralyzing.
There was one industry group on Friday that showed even greater signs of accumulation, gaining roughly 3.5% in the final 90 minutes of trading. The S&P 500 was flat during this same 90-minute period and the NASDAQ actually lost some ground, making this industry group's recovery stand out even more. I'm featuring the group and one of its component stocks to keep an eye on in my FREE EB Digest newsletter on Monday morning. If you're not already a free EB Digest subscriber, you can subscribe HERE by providing us your name and email address. There's no credit card required and you may unsubscribe at any time.
Happy trading!
Tom


