Most of you know I'm not a fan of the media. It has zero to do with who they are as people and everything to do with how they make their money. They need visitors at their websites in order to sell ads. The best way to attract visitors is to scream, "The Sky is Falling!" You see it in nearly every headline on CNBC and there's a reason for it. More folks will click. I've found that most articles are nothing more than opinions with little facts to support claims. Therefore, I just make the choice to stay away from it altogether. The primary reason I love doing what I do is that I can use the StockCharts.com platform to illustrate not what the big Wall Street firms are saying, but rather what they're buying (or selling). You honestly cannot conceal what you're doing with your money. Supply and demand are clearly depicted on the charts. THAT is where we find the TRUTH.
Perhaps the biggest 2021 fear that the media has routinely highlighted has been inflation. Let me first say that there is no denying that we're seeing inflationary pressures. Have you been to the grocery store lately? The gas station? Home Depot? Prices have risen and, in many cases, risen very rapidly. They continue to rise. But I also believe that we're in a period of history that most of us (anyone under 100 years old) have never witnessed before. The economic imbalances first began during the pandemic with a cratering in demand vs. an oversupply. That resulted in falling prices, which is exactly what we should have expected based on Economics 101. Core consumer price index numbers don't fall very often. After dropping in two consecutive months in late 1982, we only saw 3 more monthly drops from 1983 through the start of the pandemic in 2020. Put another way, the core consumer price index was flat or gained ground 441 months out of 444. It is very normal for prices to rise. Now look at the Core CPI chart ($$CCPI) the past few years:
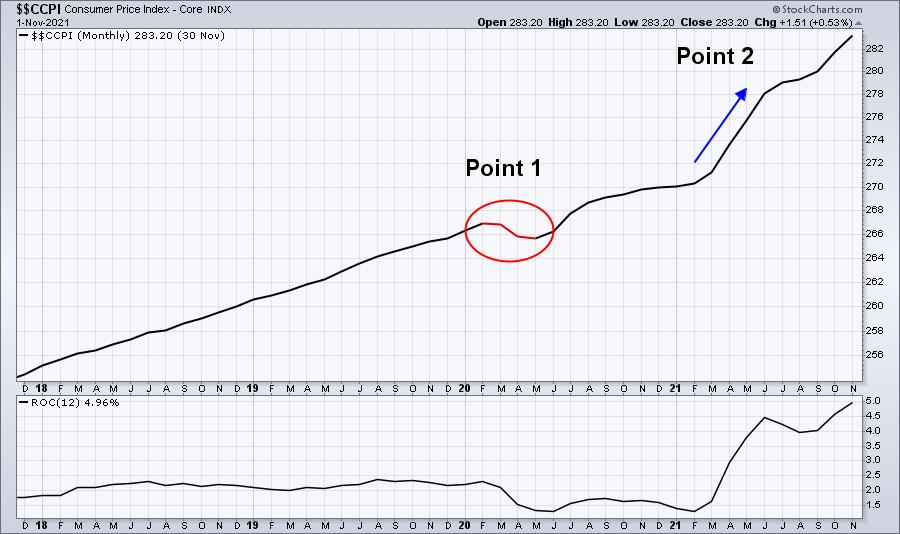
The annual inflation rate changes for two reasons. The 13th month falls out of the calculation and the latest month is added. I want you to look at "Point 1" and "Point 2" above. The March to May 2020 period was hit the hardest in terms of deflation as we saw the Core CPI fall 3 consecutive months. That had not happened in the prior 60 years. It was not due to economic conditions, however, it was due to government-mandated shutdowns and restrictions. Our economy came back very quickly and very strongly. The problem, though, is that supply chains fell way behind because our factories were shut down, so supply dwindled to levels not seen before. Again, it was Economics 101 at work. Demand accelerated very quickly. Supply doesn't just appear out of nowhere. It takes time. People have to be hired. Goods have to be produced. This "catch-up period" was occurring as demand expanded rapidly. Of course, prices will rise. That's a given. Just as the "lack of demand" issue didn't last in 2020, the "lack of supply" issue won't last in 2021/2022. But the fact is that demand outstripped supply by a very wide margin and it occurred almost exactly one year after the deflationary period (Point 2). So our annual inflation rate surged because (a) the calculation lost the 3-consecutive deflationary months and added the 3-consecutive high inflationary period from April through June 2021. I believe we'll begin to see meaningful declines in the annual inflation rate beginning in April, May, and June 2022. Expect a big rise in U.S. equities during that period. Growth stocks will explode.
So how do we know if inflation truly is a problem? I think it's easy. Here is the simple 2-step process:
- Ignore the media, because they have absolutely NO CLUE
- Follow the charts, because they DO NOT LIE
There are 3 "go to" charts for me to really analyze how Wall Street is interpreting the inflation data. These charts will help us determine if the inflation threat is REAL or FAKE.
Gold vs. S&P 500
Intermarket relationships show us rotation. As Wall Street anticipates major changes in performance ahead, they reposition themselves in the best position possible to weather the change. Inflation triggers fear. It reminds us of the 1970s. Anyone investing in U.S. equities during the inflationary 1970s remembers the stock market challenges. Gold ($GOLD) thrives on fear and fear can come in many shapes and sizes. So the fact that gold rises doesn't necessarily mean that inflation is a problem. However, REAL inflationary periods have routinely sent gold higher on a relative basis. Temporary inflation issues have not. Check out this chart:
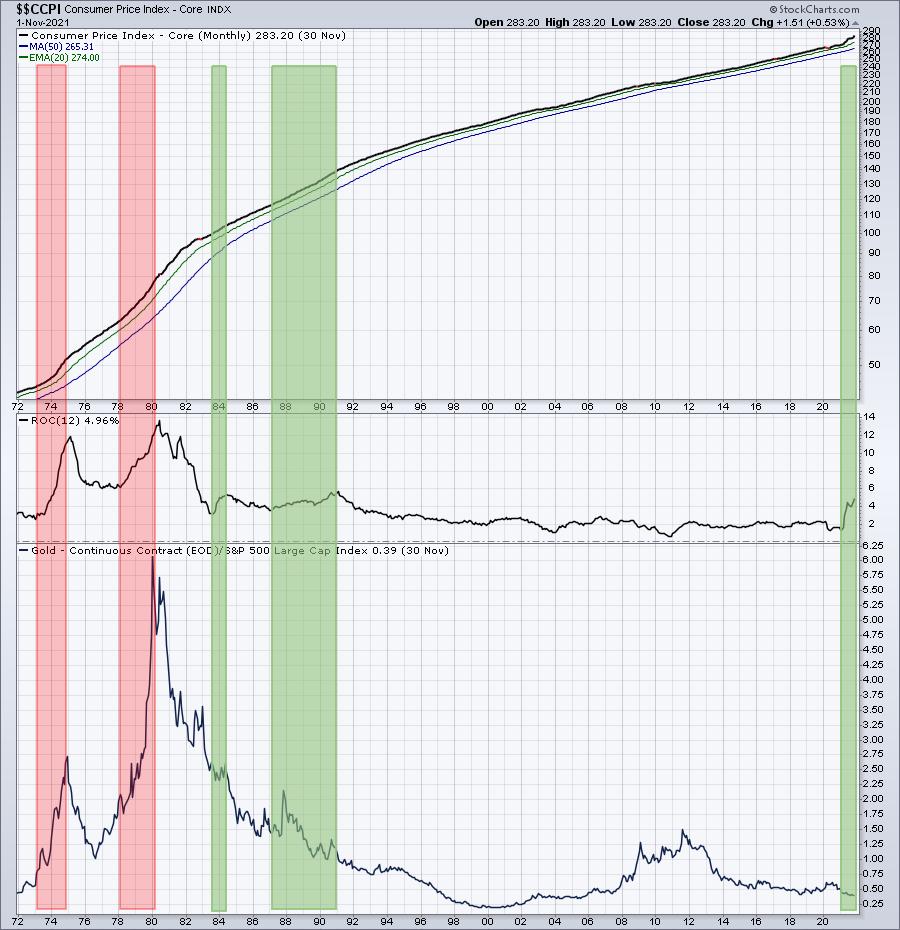
The red-shaded areas highlight the rapidly-rising gold prices relative to the S&P 500 during periods of very high inflation. There have been other brief periods - anywhere from a few months to a few years - when inflation has appeared to be problematic, but Wall Street never felt compelled to reposition in any meaningful way into gold. I believe it's very important that gold underperformed the S&P 500 during the green-shaded periods above. While the media attempts to make a HUGE deal out of inflation, gold relative to the S&P 500 has not budged. Wall Street is telling us - with their money, not their lips - that they're, collectively, not worried about inflation. So if all the MBAs on Wall Street are thus far ignoring the risks imposed by the recent spike in inflation, then why should we be selling? The media doesn't discuss that.
U.S. Dollar
Inflation weakens our currency. Those fearing inflation will sell the U.S. dollar ($USD) in droves. The dollar reacts to a lot of things, not just inflation, so I wouldn't necessarily use this as my most reliable inflation indicator. However, if inflation is truly BAD, the dollar should react quite negatively. Below is a similar chart of inflation, but this time reviewing how the dollar has reacted during rising inflationary periods:
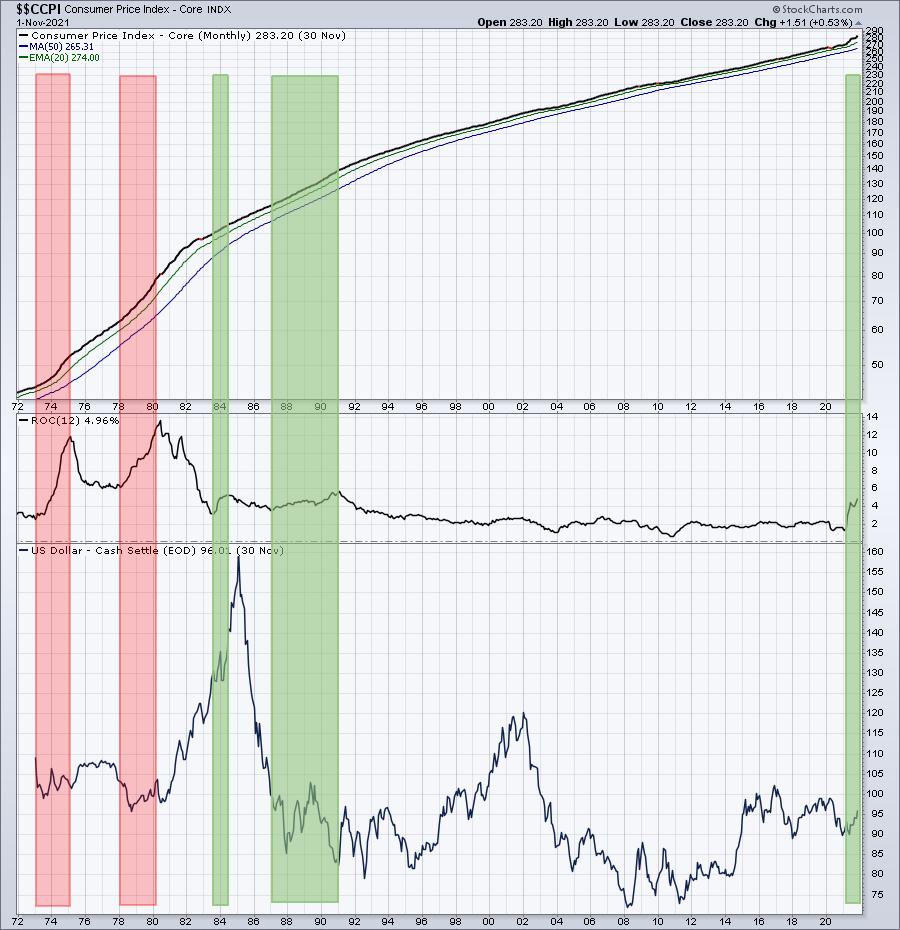
I definitely see mixed results above. Again, there are other factors that will influence the dollar. But if Wall Street is fearing much higher inflation, there would be no reason to buy the dollar. So I'll just point out that in 2021, the dollar has been on the rise throughout - certainly not a confirming sign of inflationary problems.
Growth Stocks vs. Value Stocks
The reason I would follow this relationship is simple. Rapidly-rising inflation eats away at future growth and growth stocks' valuations rely on earnings growth accelerating. Inflation makes those future earnings much less valuable. Therefore, when inflation is a problem, we should see rotation away from the NASDAQ 100 ($NDX) and into the S&P 500 ($SPX). Once again, let's look at the inflation chart and follow the rotation between an index that's more growth-oriented and one that is represented by more value-oriented companies:
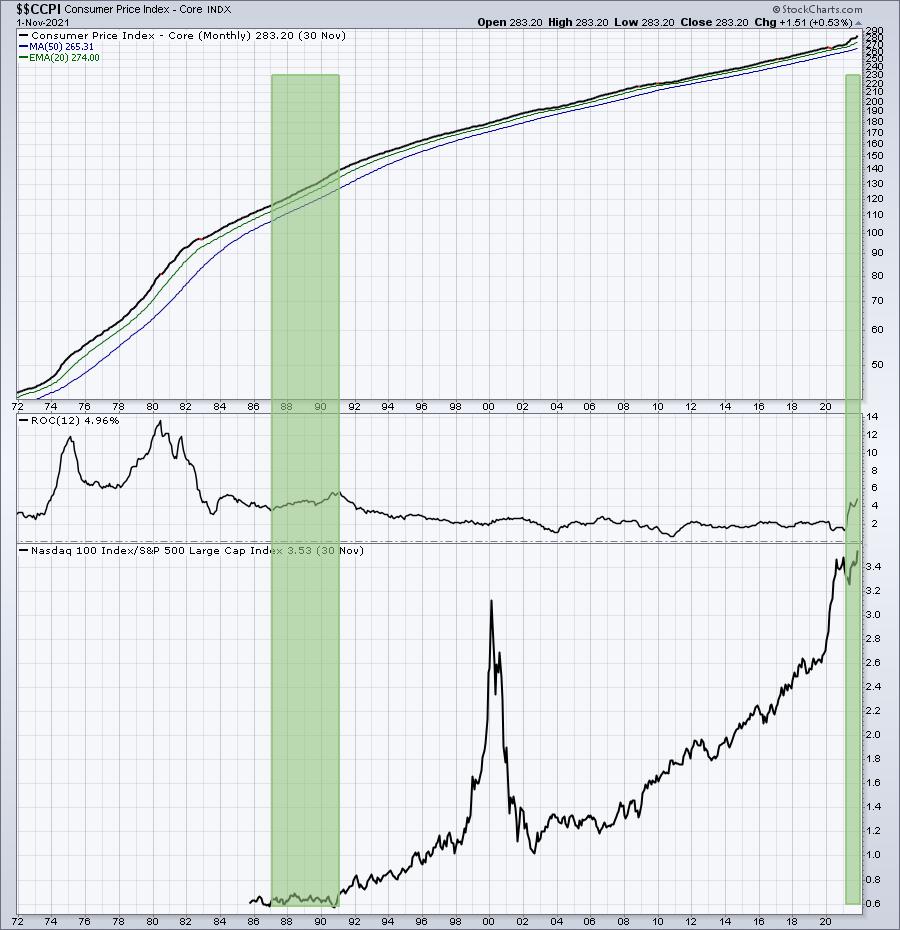
The NASDAQ 100 was launched on January 31, 1985, so we can't use this index to help us back in the 1970s. However, it is an index that features many of our largest growth companies, mostly excluding traditional financial companies (which are more value-oriented). Comparing the NDX to the SPX, in my opinion, is a very good reflection of growth vs. value. Just take one look at where we are right now - at another all-time high! Is Wall Street showing signs of fear and panic over inflation? No. Then why should we? Stop reading the headlines and follow these charts.
My entire point here is to use the StockCharts.com platform to help you make INFORMED financial decisions and do not rely on those who have no vested interest in your financial future. Use those irresponsible headlines and the market's knee jerk reactions to buy your favorite growth stocks.
On Monday, I'll be featuring a growth stock in our free EB Digest newsletter. This company is in a very strong industry group, recently beat both revenue and EPS expectations, and then raised future revenue guidance. This type of growth and forecast will likely keep a bid under the stock for the foreseeable future. To join our growing EB Digest community of knowledgeable investors and traders, CLICK HERE to enter your name and email address. There's no credit card required and you may unsubscribe at any time.
Happy trading!
Tom


