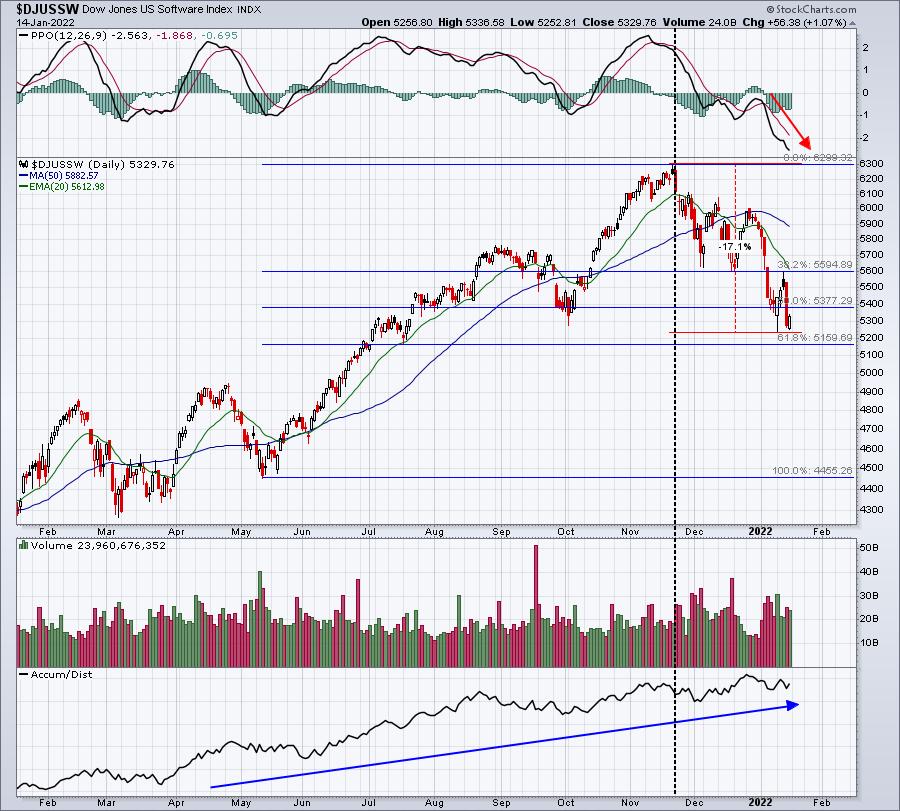
Renewable energy ($DWCREE) and software ($DJUSSW) have been absolutely smoked since November. In the case of software, the selling has accelerated in January with its PPO falling off a cliff:
This group had declined more than 17% off its recent high - before the rally from Monday's low. Options traders, however, have grown so pessimistic that any short-term selling should probably be viewed as an opportunity on the long side. Market makers could help this group soar at almost any time, because of monthly max pain. There's currently a tremendous imbalance between open call interest and open put interest, with many, many more in-the-money put options in play right now. This never provides us a guarantee of short-term higher prices, but, in my view, the odds of a rally increase substantially during options expiration week or early into the week following options expiration.
As I look at this software chart, a few technical considerations to note. First, the fibonacci retracement tool identifies the key 61.8% retracement level as 5159.69. Monday's low was 5235.35, which was pretty close. While this is a normal area to bounce from, the acceleration in downward momentum and that very weak PPO suggests that any short-term buying will likely be capped by the declining 20-day EMA. So perhaps we get an options-related bounce, held back by the 20-day EMA resistance, followed by another plunge. Longer-term, though, there is one bullish indication on this chart. Despite the huge decline in price (software is nearly in a bear market), the accumulation/distribution line (AD line) continues to rise. I believe that Wall Street is using this decline to accumulate software stocks for a later surge in 2022. I see an explosive rally ahead in growth stocks - maybe in 2-3 months - but we have to deal with the inflationary and higher interest rate scare first.
But let me get back to "max pain". I define max pain as the point in which in-the-money call premium equals in-the-money put premium. To illustrate the short-term option issue in software, I'll look at the open interest on the iShares North America Tech-Software ETF (IGV). I've calculated the net in-the-money put premium right now at roughly $42.5 million. Every dollar that the IGV were to rally this week, this net put premium would drop by $1.7 million. Therefore, from a max pain perspective, there's financial incentive for the IGV to push higher. Here's the calculation on an Excel spreadsheet:
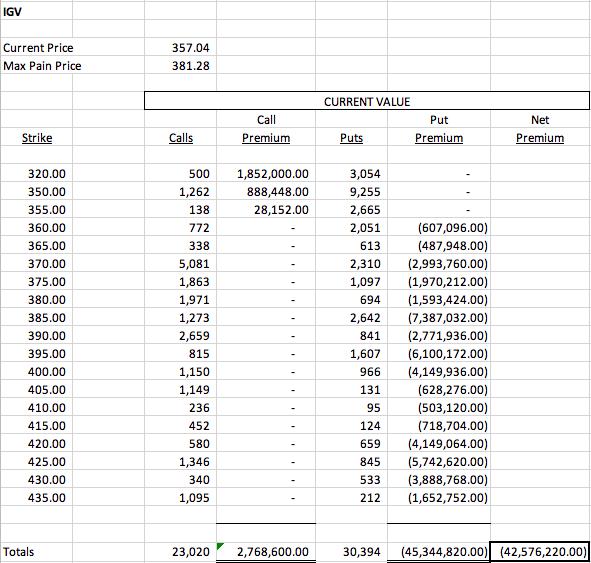
As the price of IGV rises, the value of the open calls increases, while the value of the open puts decreases, eroding that net put premium, which currently stands at $42.5 million. The "max pain price" on this spreadsheet refers to the price level where the net put premium would return to zero. I'm not suggesting that the IGV will be at 381.28 come Friday. Instead, I use this information as a directional clue. While the IGV may continue falling, I believe the odds suggest we'll see a rally this week. As a trader, this provides me enough of a clue that I'd refrain from betting against software stocks this week.
After this week concludes, I'd be back on the defensive with software. In addition to its technical issues stemming from the recent selling, there's also a seasonality component to be aware of. February has been the worst month for software stocks over the past two decades. Microsoft (MSFT), for instance, typically does not start the year off right. February is especially weak historically. Check this out:
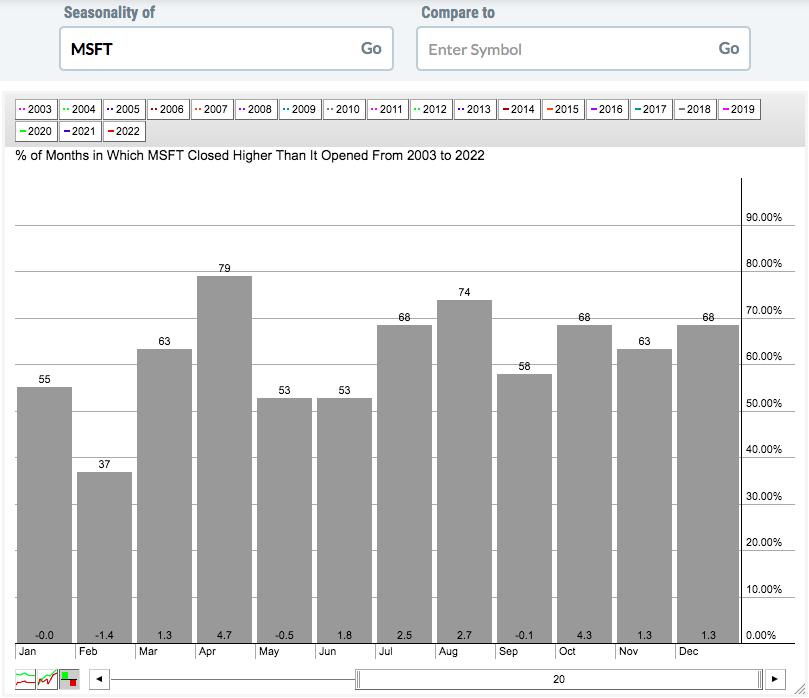
MSFT has advanced only 37% of Februarys this century and its average return of -1.4% is, by far, its worst performance among the 12 calendar months. As we move into March and April, however, MSFT tends to perform extremely well and I believe this seasonal pattern could line up beautifully with what I'm expecting from the overall market in 2022. I would not give up on software. Rather, I'd use this weakness to accumulate - exactly as Wall Street appears to be doing.
If you like seasonal stats, then you'll LOVE one that I have for Apple (AAPL). I was not even aware of one seasonal pattern on AAPL until I stumbled upon it recently. I plan to feature it in our next EB Digest newsletter on Monday morning. If you're not currently a subscriber, it's completely FREE (no credit card required) and simple to register. CLICK HERE to enter your name and email address. Subscription to the EB Digest also provides you access to all our free events. Our first free event of 2022 is "Q4 Earnings: Sneak Preview", which will be held on Monday, January 17th at 4:30pm ET. Be sure to register for our newsletter today!
Tom


