As a short-term trader, I've always studied the short-term intraday charts, looking for any possible advantage I can gain. One strategy the market makers employ during uptrends and downtrends is they show traders a morning mirage, which is then followed by afternoon reality. Not every day is alike, but uptrends can often see morning weakness to encourage those who don't believe to sell or even sell short. Once those decisions are made, you're left wondering what happened later in the afternoon when everything has reversed and looks much more bullish. The opposite holds true during downtrends - we tend to see head fakes to the upside in the early trading hours and then weakness into the close.
Let me illustrate how the last downtrend looked on the NASDAQ's 1-month, 30-minute intraday chart:
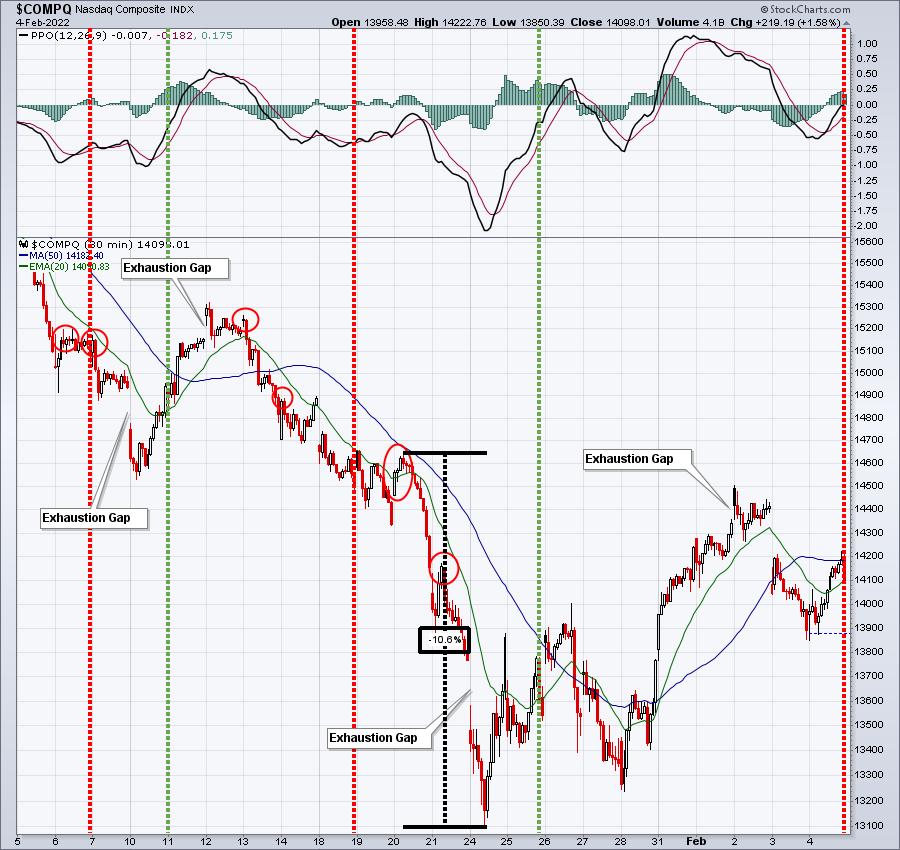
4 points I'd like to make here:
- The red-dotted and green-dotted vertical lines mark the beginning of periods of historical weakness and strength, respectively. For instance, the 7th through the 10th of all calendar months have produced negative returns since 1950. The 11th through 18th is typically bullish. The 19th through 25th is THE WORST time of the calendar month and the 26th through the 6th is the most bullish period of the calendar month. While not perfect, you can see that the one significant decline (over 10% in 24 hours) occurred during that bearish 19th through 25th period. It's important to understand how the stock market historically trades.
- The red circles highlight morning strength and tops during the last downtrend. That was the "mirage" I discussed earlier. By day's end, that morning strength was long gone, so anyone buying during the morning excitement was feeling substantial pain by the close.
- The almost unfathomable 10.6% decline in two days is what I refer to as "market makers going on vacation." Their primary function is to provide liquidity. If someone wants to sell, market makers should be there to buy, even if there are no other willing buyers (outside of market makers). When we see extreme volatility, market makers go on vacation and the HUGE supply vs. little or no demand causes that massive short-term decline. That's capitulation, which normally provides at least a short-term level of support as market makers finally decide to deploy their capital. That's the key signal of a short-term bottom.
- Exhaustion gaps will many times mark key reversals during significant uptrends or downtrends. On the chart above, I counted four exhaustion gaps that marked key reversals on this 1-month chart. When you see a big gap down following an extended decline (or big gap up during an extended advance), be prepared for a potential reversal.
The above is EXTREMELY important to a trader. It can help you bank profits near key pivot points and potentially move to the opposite side of the trade, if that's your style.
I expect at least one more major decline this quarter, and quite possibly a few more. The latest decline may have already started or maybe it occurs after a period of sideways consolidation, but I don't think we've seen the end of the extreme volatility and downside action.
One historical factor that suggests we're not nearly done in terms of selling is the January Effect. There's a very strong positive correlation between January performance and the rest of the year performance. If you haven't seen the numbers before, they're quite fascinating and I'll be sharing them in our January Effect webinar that's slated to begin at 10:00am ET today. We require a FREE EB Digest subscription to attend our free community events. However, if you'd like to come directly into the room using the link below, we'll make sure that you're added to this free newsletter. There's no credit card required and you may unsubscribe at any time. Here's the room link:
https://earningsbeats.zoom.us/s/88693491836
Please note that the room will open at 9:30am ET, 30 minutes before the start of the event. We will begin the event promptly at 10:00am ET. If you're reading this after the event has concluded, you can CLICK HERE to subscribe to our newsletter and we'll be happy to send you a copy of the recording.
Happy trading!
Tom


