Perhaps the most exciting part of any trader's journey is catching that runaway short squeeze. Many traders have only dreamt it, while others have lived it. GameStop Corp (GME) is the most recognizable short squeeze stock of this generation as it soared from 20 on January 13, 2021 to 483 on January 28, 2021. That's right, GME gained 2315% in 15 days. It wasn't anything fundamental driving the price higher. It was simply the combination of a price breakout on heavy volume with the highest level of short % of float in our history. That short % of float reached 140%.
Let me help you understand what that means, if you're not familiar with the concept of short selling. Currently, GME has 76.3 million total shares outstanding, of which 63.0 million are available for trading by the public (float). To have a short % of float at 140%, traders have to borrow 88.76 million and sell them. Buying stocks on margin can inflate prices to the upside and selling short can abnormally deflate prices. Then, just as margin calls can trigger indiscriminate selling, a short squeeze can trigger panic buying. These situations have nothing at all to do with fundamentals. It's simply trading inefficiencies. In the case of short selling, it's insatiable demand for a stock, combined with limited supply. It's Economics 101. Prices rise and they rise rapidly.
The important part of this, however, is that if we do our homework, we can be fully prepared for these surging prices before they happen. Four months before GME had its crazy short squeeze run, I had published an EBD article on September 1, 2020:
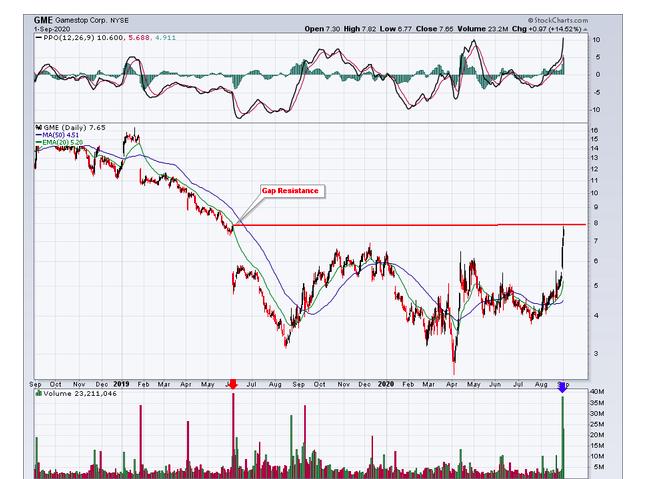
Major gap resistance existed at 7.82, which is what I was looking for to potentially trigger shorts to begin covering in a major way. The first close above 7.82 occurred on September 16, 2020, when volume exploded higher and GME closed at 8.68. We never saw the 7.82 level again. A little more than 4 months later, GME hit that 483 level that rewrote the record books. Please understand this is a short squeeze example that may never be duplicated again. But short squeezes, to a lesser degree, happen all the time.
Currently, several stocks are beginning to build their own cases of potential short squeezes ahead. One such company was featured in our EB Digest article this morning - SmileDirectClub (SDC). First, understand that SDC's short % of float stands at 31% - a very high number, but clearly it's not shorted to the degree that GME was. There are a few factors, however, that make it a stock to watch. Check out the chart:
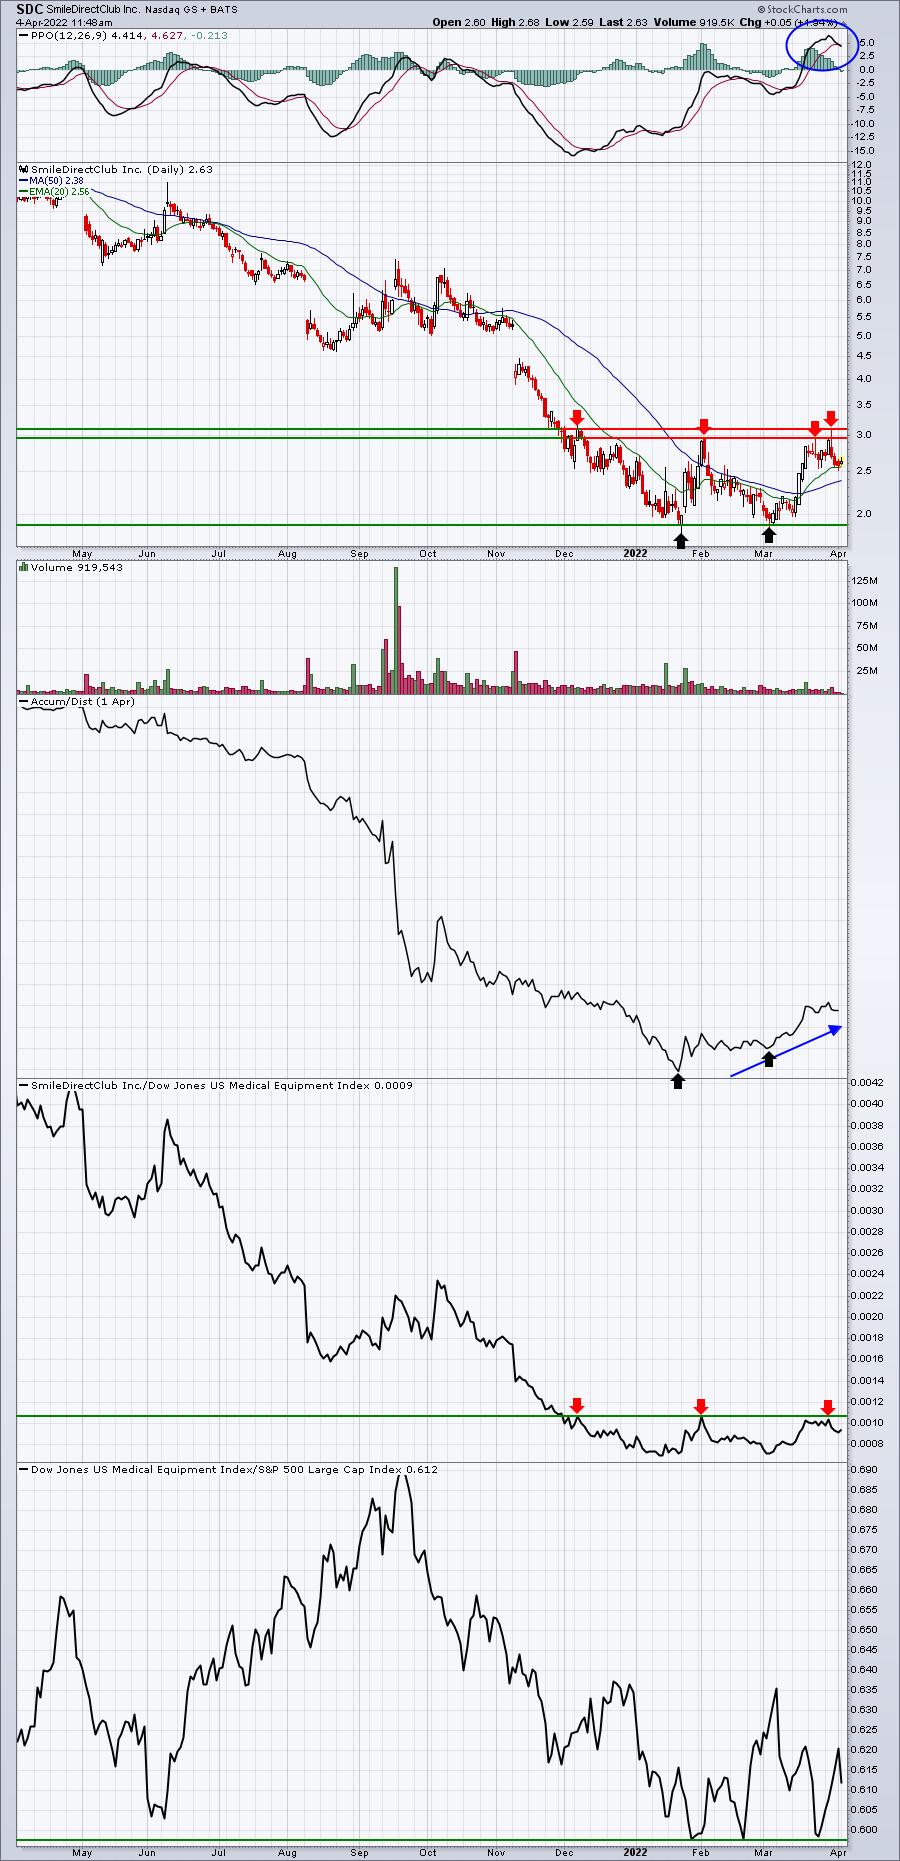
The daily PPO has turned decidedly positive, which tells us that SDC finally has at least a bit of bullish price momentum. There hasn't been a key price breakout, though. I believe SDC needs to clear the 3.00-3.15 overhead price resistance range in order to even begin thinking about a short squeeze. We've already seen four failed breakout attempts. SDC also resides in the health care sector, which has been seeing 2022 inflows due to Wall Street's rotation into defensive areas. If the Dow Jones U.S. Medical Equipment Index ($DJUSAM) can continue holding relative price support vs. the S&P 500 (bottom panel in chart above), that too would provide a better environment in which SDC could flourish. The black arrows above show SDC improving its AD line while price lows were retested. It's setting up for a potential short squeeze, but it does not confirm until we see volume increasing significantly and SDC breaking out above 3.15.
In Wednesday's EB Digest, I'll provide one of the most heavily shorted stocks in the market today. I'll also provide a link and password for all subscribers to see (and download, if you're a StockCharts.com Extra or Pro member) our entire Short Squeeze ChartList (SSCL), which features 39 of the most heavily shorted stocks right now. Any of these 39 could morph into a short squeeze at any time, so it's definitely a list worth having. If you'd like to see Wednesday's article and receive this link and ChartList, CLICK HERE to start your FREE EB Digest subscription. There is no credit card required and you may unsubscribe at any time.
Happy trading!
Tom


