In addition to my non-stop writing in 2022 about the bearish market environment and why I believe we're going lower, I've also provided EarningsBeats.com members with some valuable historical information.
Here was an excerpt from last Monday's Daily Market Report (DMR) to our members (I publish a DMR every day the stock market is open):
"Let's talk historical performance. Today is April 18th.....The next 10 calendar days through April 28th have been historically flat over the past 7 decades. If Wall Street's not buying companies ahead of their earnings reports, that tells me one thing. They don't anticipate a strong earnings season - or at least they're concerned about possible warnings."
I then discussed more specifically the outlook for technology (XLK) and consumer discretionary (XLY):
"I do know that the XLK and XLY house many growth stocks and they're simply not performing well right now. I'm afraid we're about to get some warnings from major technology and discretionary names.....we'll soon find out."
The very next day, Netflix (NFLX), an internet stock ($DJUSNS) dropped a BOMB on investors and reported that subscribers dropped for the first time since 2011. On Wednesday, Lam Research (LRCX) missed its earnings estimate, which triggered another selloff of semiconductor stocks ($DJUSSC). On Thursday, it was Snap, Inc.'s (SNAP) turn as it reported an unexpected quarterly loss, also missing its revenue estimate, encouraging further selling in the internet space. The scary part is that we haven't really seen many big NASDAQ companies report yet. Tesla (TSLA), despite blowout results that easily beat expectations, traded down 8% after an opening gap higher on Thursday following earnings. If blowout numbers can't generate buyers, what will next week look like after Microsoft (MSFT), Alphabet (GOOGL), Meta Platforms (FB), Apple (AAPL), and Amazon.com (AMZN) report their quarterly results? Let's hope Wall Street is in a better mood.
One company that I would not rely on this week is FB. Wall Street has been selling this stock hand over fist. FB is an exceptionally poor relative performer, so when they report, you better look out below!
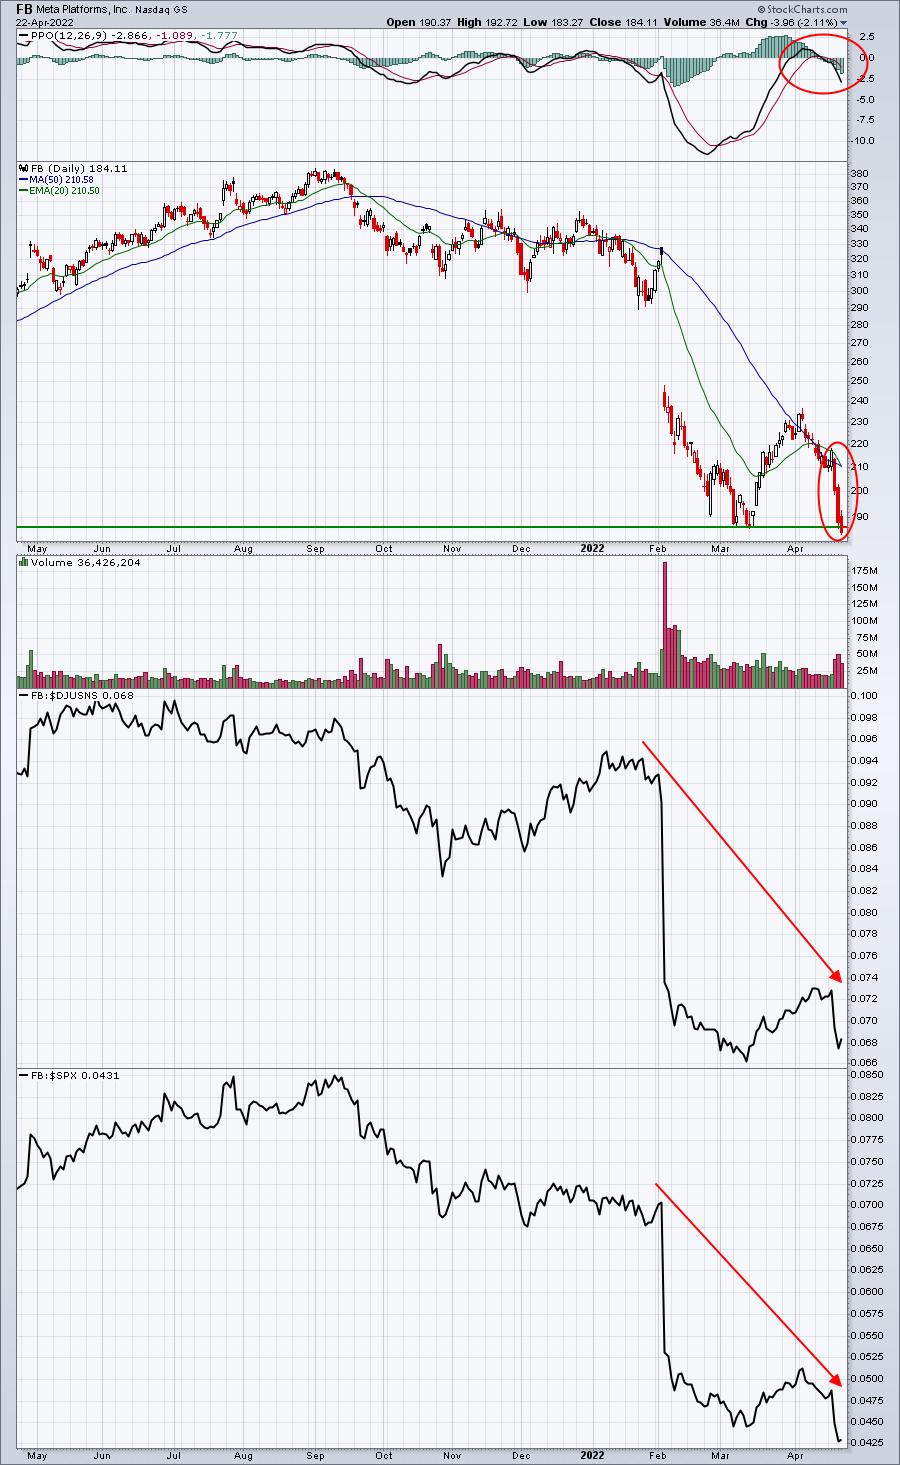
Maybe bad news is already built into FB's deteriorating price action? The bulls had better hope the bad news is built in, because I'm also certain the news here will not be good. It could be horrific. Stocks do not drop 45% in 3 months for no reason at all. Wall Street has been bailing out of FB for many weeks now and we'll likely find out why on Wednesday.
There's one very interesting common denominator about the impulsive bouts of selling in 2022. Look at the shaded areas on the S&P 500 chart below and see if you notice one thing in common (before you scroll down for the answer):
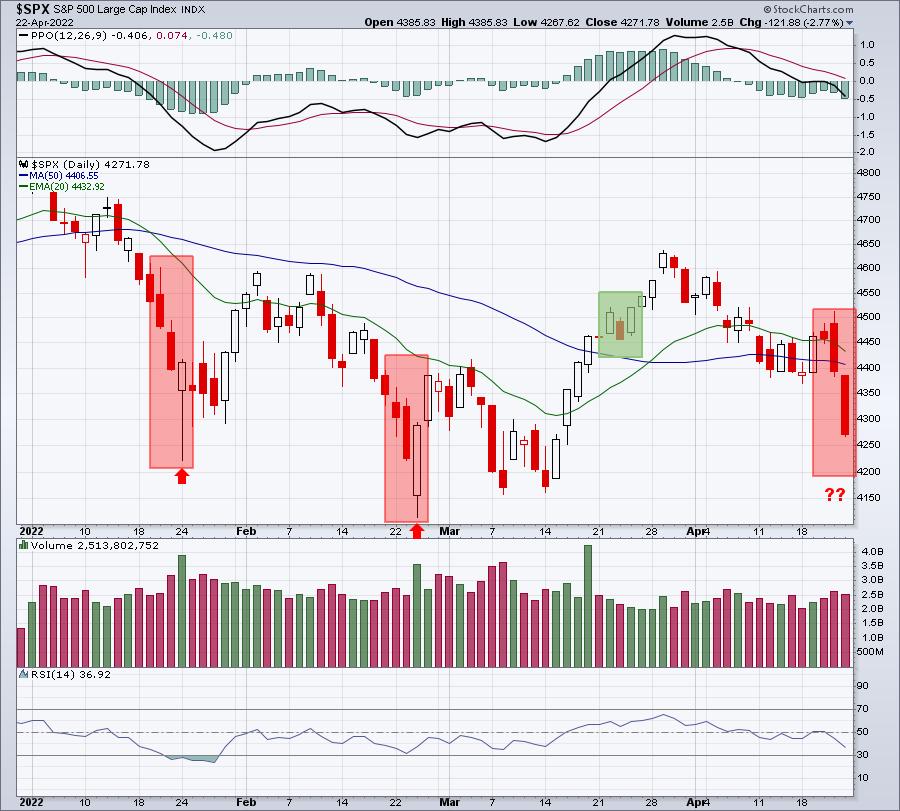
Do you see it? What's the one thing that's the same between all of the 4 highlighted periods?
(Scroll down)
(Scroll down)
(Scroll down)
(Scroll down)
(Scroll down)
(Scroll down)
(Scroll down)
Answer: It's the same time of each calendar month. I've studied the daily history of trading on our major indices since 1950. That's 253 trading days per year and my spreadsheet is in its 73rd year. That's a lot of trading days. There are 3 VERY IMPORTANT historical trends that EVERY trader should be aware of. These three nuggets of historical knowledge will make a big difference in your trading.
Here's the best part. I'll provide you these 3 historical secrets in a Market Timing Series that I've just finished writing. CLICK HERE and be sure to provide me your name and email address. The first email will highlight 10 consecutive days of the calendar month that account for 80% of the S&P 500's gains since 1950. That's right. Roughly one-third of all trading days since 1950 account for 80% of the gains. When I first realized this, I was stunned (kinda). But this knowledge has made me a much better trader, because my odds of trading success immediately shot higher. Again, CHECK THIS SERIES OUT and become a better trader!
Happy trading!
Tom


