I tend to be very optimistic in my view of the U.S. stock market. I think for good reason, by the way, as 54 of the last 72 years have resulted in U.S. stocks gaining ground. That means only 25% of calendar years since 1950 have resulted in lower prices. Year to date, the S&P 500 has lost 22.9%. From the top in early January, which I called, the S&P 500 has declined 23.74%.
Let's put this 2022 decline in historical perspective. In February, I did an "Anatomy of A Cyclical Bear Market" webinar for EB.com members to illustrate what they should expect from this cyclical bear market. I went back to 1950 and highlighted every bear market - there were 13 of them. 10 turned out to be fairly short-lived cyclical bear markets (more common) that averaged 27.38% declines, while the other 3 were longer-term secular bear markets (less common) that averaged 52.71% declines. Determining the difference is obviously quite important. I felt from the very beginning this could be a cyclical bear market within a secular bull market. After the two secular bear markets in the 1930s/1940s and the 1970s, the ensuing secular bull markets lasted roughly two decades AFTER the S&P 500 broke out above its bear market highs. If we take that same approach to the 2013 breakout of the S&P 500, we're looking at a secular bull market that should carry us the rest of this decade and into the early 2030s. Here's the BIG PICTURE to illustrate these "super cycles":
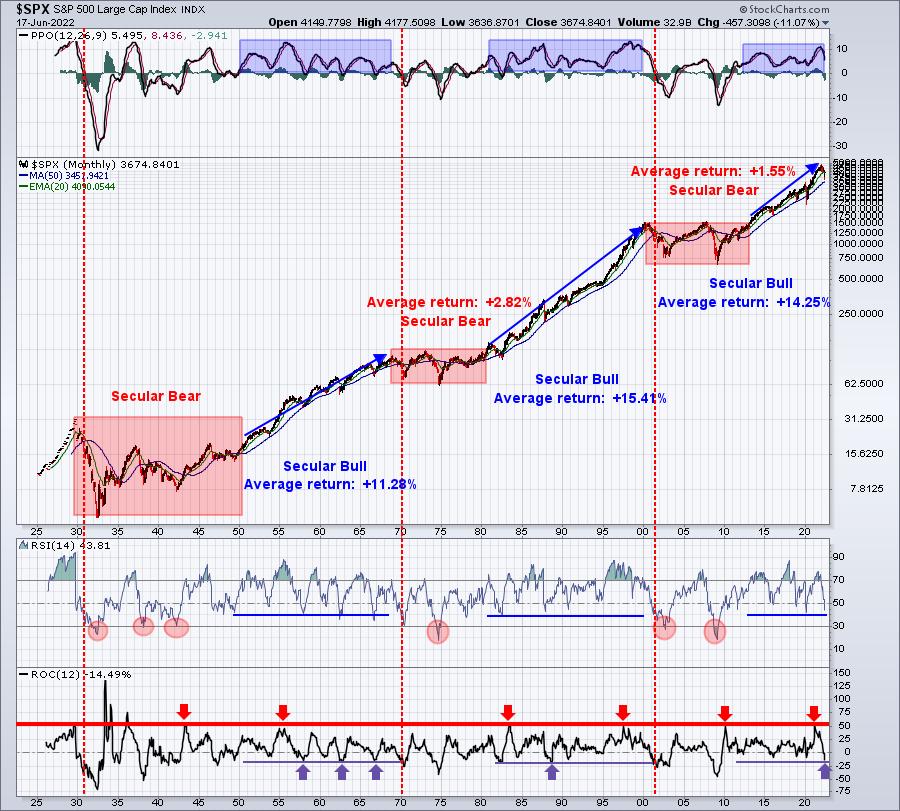
I believe we're in a long-term period of money rotating INTO U.S. equities. The current cyclical bear market is no different than others we've seen in this or other secular bull markets. If you look at the monthly RSI, you'll see blue horizontal lines at monthly RSI 40. This level tends to offer great support when we run into periodic cyclical bear markets during secular bull markets and we're currently at monthly RSI just below 44. We were above 70 when this cyclical bear market began.
Let me give you some history about bear markets, so that you can at least be better informed as to how prior bear markets have played out. I'm not trying to convince anyone of what I believe. I simply pass along what I've learned over the years, provide my opinion as to what I believe is happening or will happen, and then it's up to you. One of the staples at EarningsBeats.com is MARKET EDUCATION, along with MARKET RESEARCH and MARKET GUIDANCE. What our members do with our information is completely up to them. I just want to provide as much quality information as possible, so they're better able to make solid financial decisions.
Here are FACTS about every bear market that we've endured since 1950:
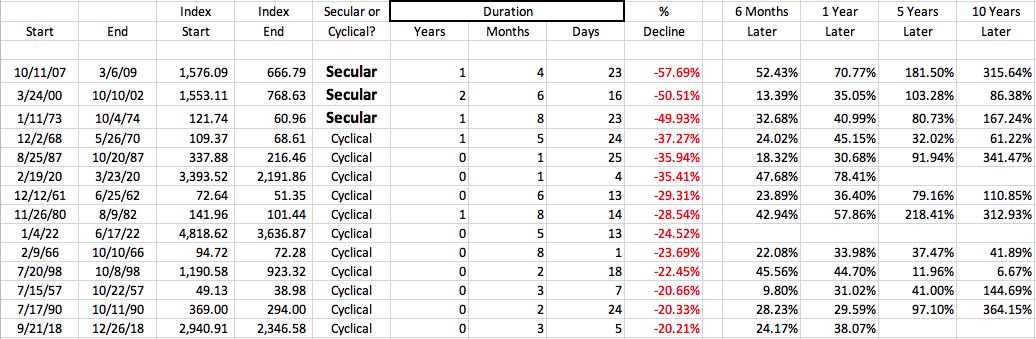
The "Index Start" and "Index End" is the S&P 500 value at the beginning and end of every bear market over the past 72 years. I've sorted these 14 bear markets in percentage decline order. The four columns to the right show how the S&P 500 performed over the next six months, one year, five years, and 10 years from each bear market low. Any blanks in these 4 columns means that the necessary time has not elapsed yet.
Note that the current cyclical bear market shows from top to bottom that the S&P 500 has fallen 24.52%, which right now ranks it as the 9th worst bear market since 1950. Most analysts would agree that the bottom isn't in yet, so this decline is only going to get worse. I'm not among "most analysts", as I called the low this past week THE bottom. For me, it's not about being right or wrong. Instead, I'm trying to manage my risk - not only when the market tops, but also when it could be bottoming or approaching a bottom. Look at those 1-year returns after bear market lows. If you can avoid being in the stock market during big declines (which we've done in 2022) and then invest when much of the risk has passed, those 1-year, post-bear-market returns paint quite a nice picture.
In my Trading Places Live episode on Thursday, I made the bold prediction that the bottom is in. Whether you agree or disagree with me isn't of much concern. It's just my opinion and you're certainly entitled to yours. I laid out my reasons and that was the purpose of my message. I got quite the reaction on YouTube, though, with most disagreeing. If you'd like to listen to my reasoning, you can CHECK IT OUT HERE.
I'm also planning to discuss the bullish signals I'm seeing in our free EB Digest newsletter this week. If you're not already an EB Digest subscriber (again, it's free with no credit card required), please CLICK HERE and sign up with your name and email address.
Happy trading!
Tom


