One very interesting and intriguing part of stock trading is that Wall Street disguises their buying/selling and rotation, as many times the absolute charts don't tell us the REAL story. I want you to look at the absolute price action in both mid-cap growth ($DJUSGM) and mid-cap value ($DJUSVM):
Mid-Cap Growth:
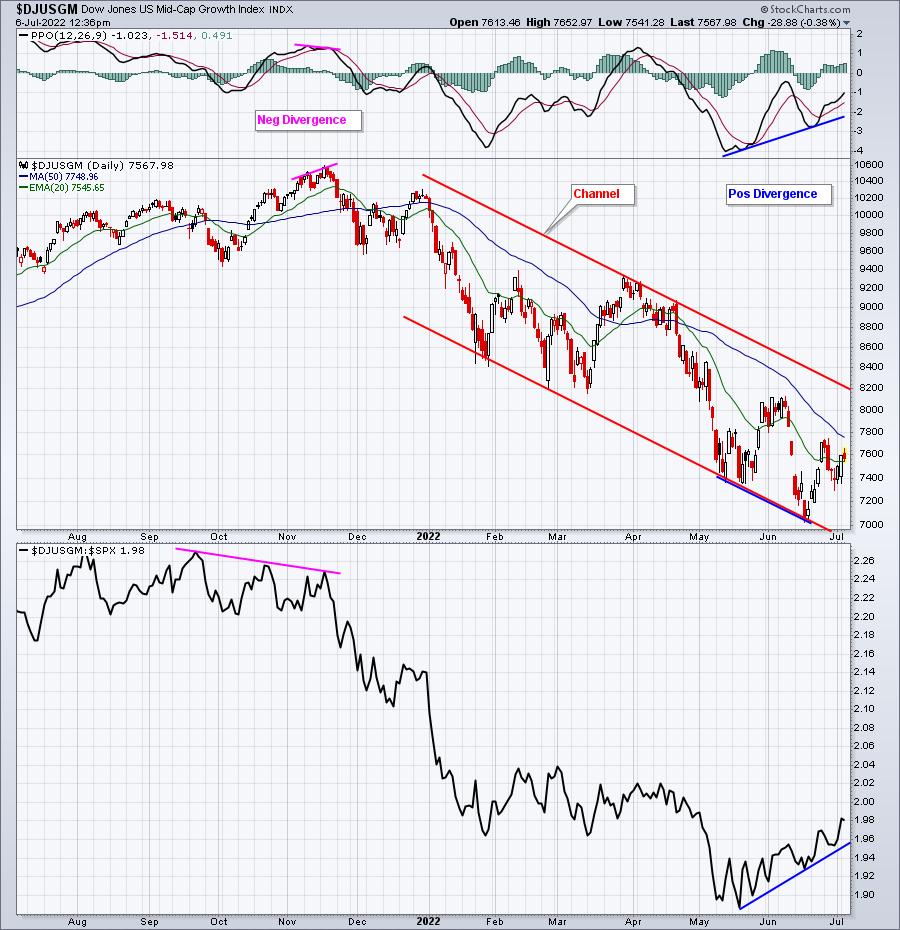
If you do not look at relative strength, doesn't the DJUSGM simply look like it's downtrending within a channel? Does it show any sign of hope? I don't think so. BUTTTTT, under the surface, these growth stocks are suddenly showing bullish rotation and relative strength vs. the benchmark S&P 500. This is why relative strength is SO critical in your evaluation of market strength/weakness. The absolute chart says SELL, but the relative chart shows bullish rotation. Note that the opposite occurred at the DJUSGM high in late 2021. Absolute price action looked solid, moving to fresh new highs, but Wall Street was rotating OUT of this asset class. Only relative strength showed this subtle reallocation.
Mid-Cap Value:
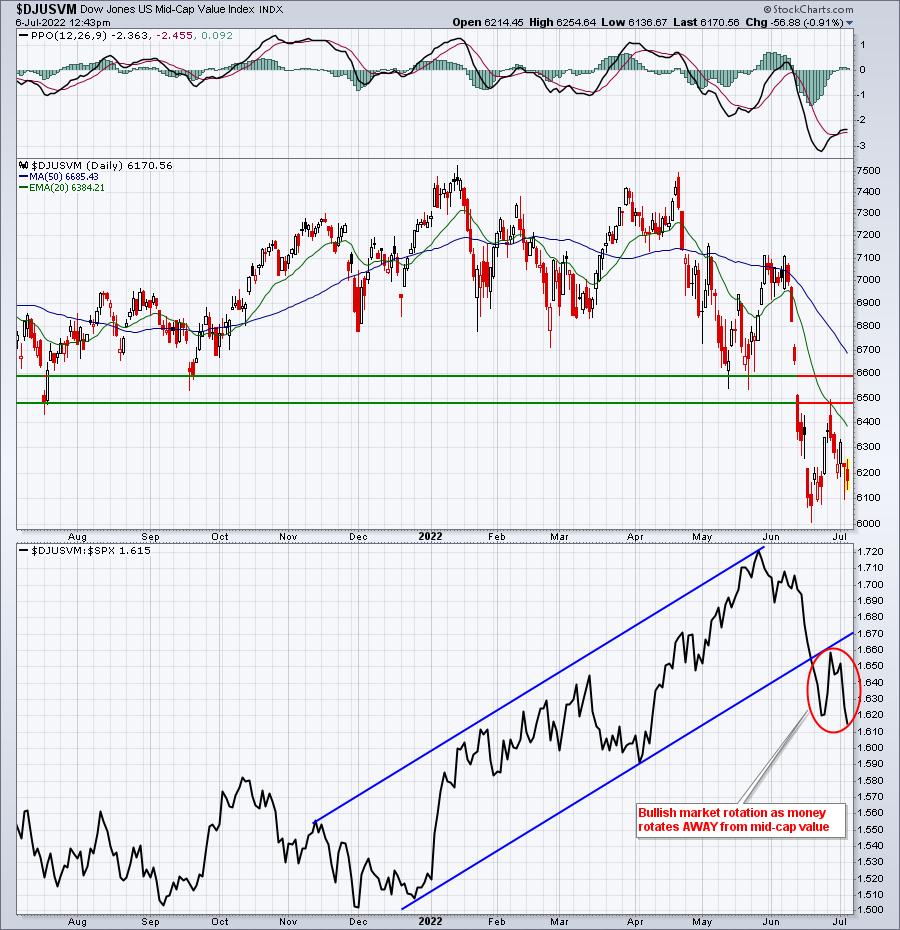
The absolute chart simply shows a breakdown and further weakness in another area of the market - a bearish signal. But notice that these value stocks were "relative" leaders during the market weakness in 2022. That's typical during a bear market as traders want to eliminate the risk that are inherent with growth stocks, so they "rotate" to value stocks. It doesn't mean that value stocks go higher, but rather that value stocks OUTPERFORM. Now look again at that bottom panel. Do you see the rotation AWAY from value stocks, relative to the benchmark S&P 500?
This is insanely important in evaluating the stock market.
The above two charts were both looked at independently and vs. the benchmark S&P 500. I actually prefer, however, to look at an S&P 500 chart, with a panel below that compares mid-cap growth vs. mid-cap value($DJUSGM:$DJUSVM). I call it a "sustainability ratio". If the S&P 500 is going higher and this sustainability ratio is going higher, it tells us that growth remains in favor and the S&P 500 strength is likely (note I didn't say guaranteed - no such thing as a guarantee) to keep moving higher - with profit taking normal along the way. And during a correction or bear market, I'd expect to see that DJUSGM:DJUSVM ratio declining to support a further decline in the S&P 500. Having said all of this, check out how this chart currently looks:
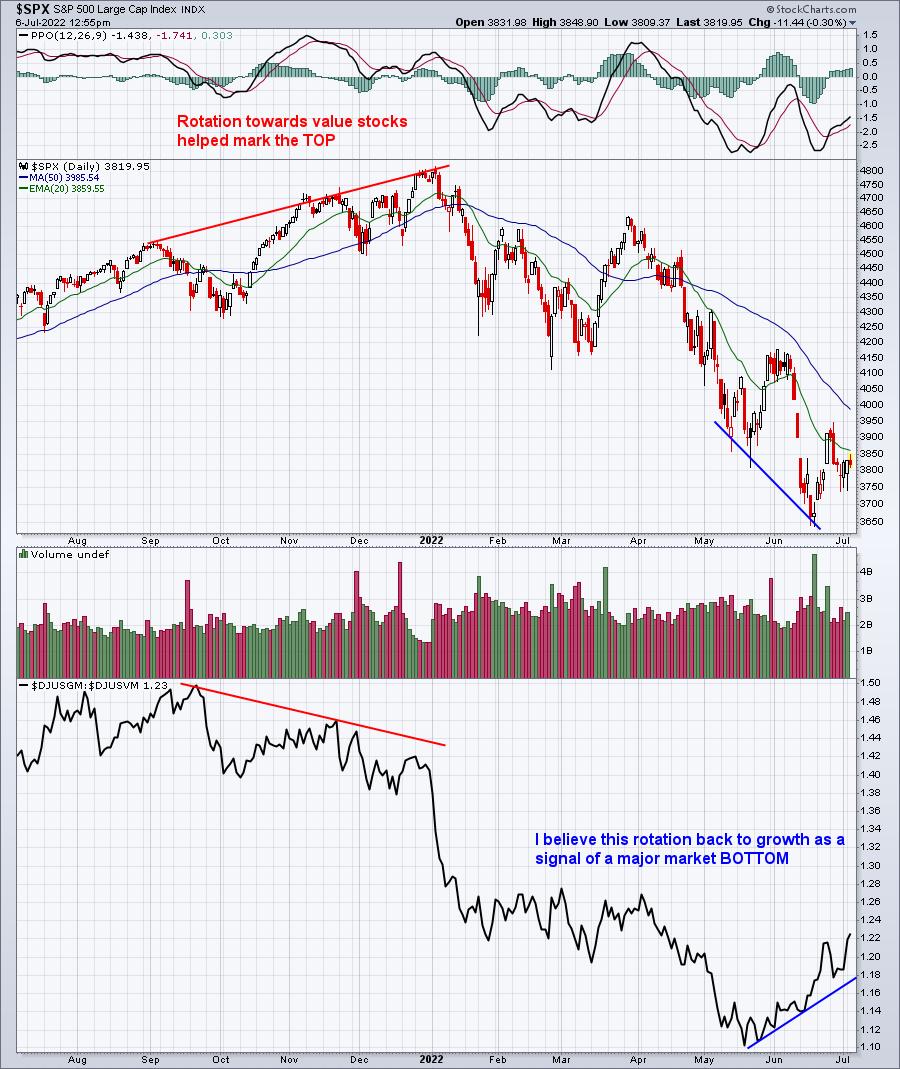
Ask yourself a very simple question and be honest. If inflation fears and/or recession fears are likely to send U.S. equities spiraling lower in the second half of 2022, WHO IN THEIR RIGHT MIND WOULD BE ROTATING OUT OF VALUE AND INTO GROWTH? Seriously, who?
When you come up with an answer to that question, please respond in the comments below. If you'd prefer to keep your comments private, send an email to me at "support@earningsbeats.com". My approach to stock market investing/trading is one of common sense. I ignore all the brainwashing found at media outlets and follow the charts. Please tell me what I'm missing in the growth vs. value story that the charts above are telling.
Also, TONS of mid-cap growth stocks are looking so much better on their charts and I'll feature one in my next EB Digest newsletter. To subscribe for FREE (no credit card required), simply CLICK HERE and provide us your name and email address. We'll provide you that mid-cap growth stock chart and writeup with our next newsletter article on Friday.
Happy trading!
Tom


