We're going higher. Sure, we'll have pullbacks along the way. Secular bull markets typically test their key moving averages like the 20-day EMA and/or 50-day SMA frequently, and I'll be looking for those in the weeks and months ahead. But it's looking much less likely that we'll see a double bottom to test the mid-June low.
There are one very important signal that tells me this rally is sustainable. Money continues to rotate into aggressive sectors. One way to illustrate this is to simply look at the 1-month returns of all sectors and check out the leaders:
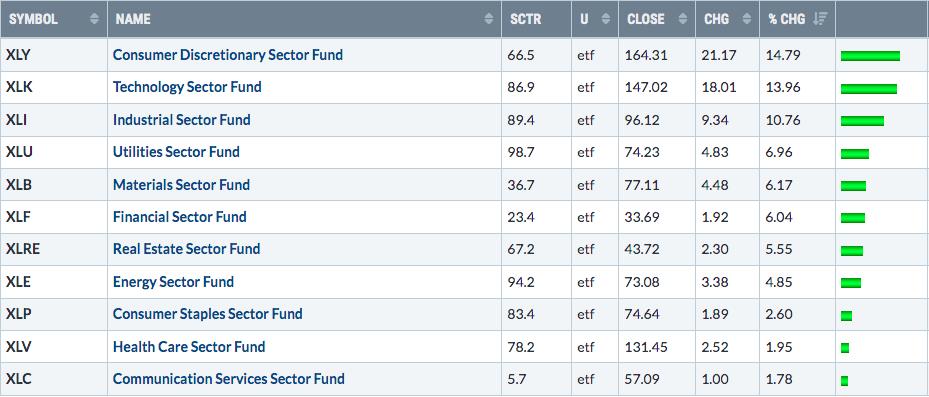
You'll find most of the aggressive sectors at the top, including the key discretionary (XLY) and technology (XLK) in the top two spots and nothing else is really even close. Meanwhile, consumer staples (XLP), the other and more defensive half of consumer stocks, is near the very bottom. I've found, through much research, that the relationship between the XLY and XLP is one of the most important relationships in determining the sustainability of an S&P 500 rally or decline. First, let me show you the extremely strong positive correlation that exists this century:
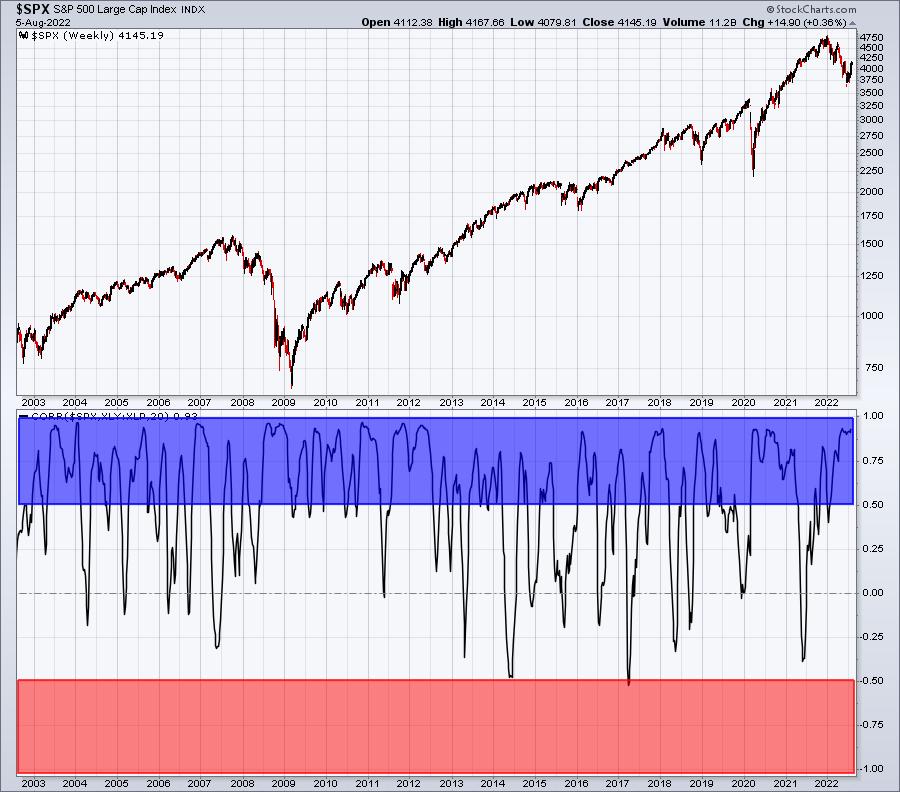
This is a 20-year weekly chart. I believe it's important to go back to the turn of the century, because it incorporates both strong secular bull market behavior AND strong secular bear market behavior. There are no rose-colored glasses here. I stripped everything off the S&P 500 chart, so we can focus on two things. One, the direction of the S&P 500 price action. Two, how that price action correlates with the relative price action of the XLY:XLP ratio. The correlation coefficient in the bottom panel highlights whether the S&P 500 is moving in lock step with the XLY:XLP (readings at or near +1) or is moving in inverse fashion (readings at or near -1). The blue-shaded area highlights periods when the S&P 500 and the XLY:XLP ratio are VERY positively correlated, while the red-shaded area highlights periods when the S&P 500 and the XLY:XLP ratio are VERY negatively correlated (moving opposite).
I don't think this will take much in the way of analytical skills to see how powerful this consumer stock relationship is. And the beauty of it is that it really makes good common sense! Consumer spending is estimated to comprise two-thirds of our GDP. Understanding whether Wall Street is buying discretionary stocks (they sell us the things we WANT) or staples stocks (they sell us the things we NEED) provides us tremendous clues as to future market direction and economic expectations. A rising market supported by a rising XLY:XLP ratio suggests the rally is sustainable. When the market rises without a rising XLY:XLP ratio, the rally is much more questionable. Remember all the cautiousness I discussed back in December - BEFORE the cyclical bear market began? A big reason for my bearish stance was the rotation by Wall Street OUT of discretionary and INTO staples as the S&P 500 was setting its final pre-bear market high. This is what it looked like back then:
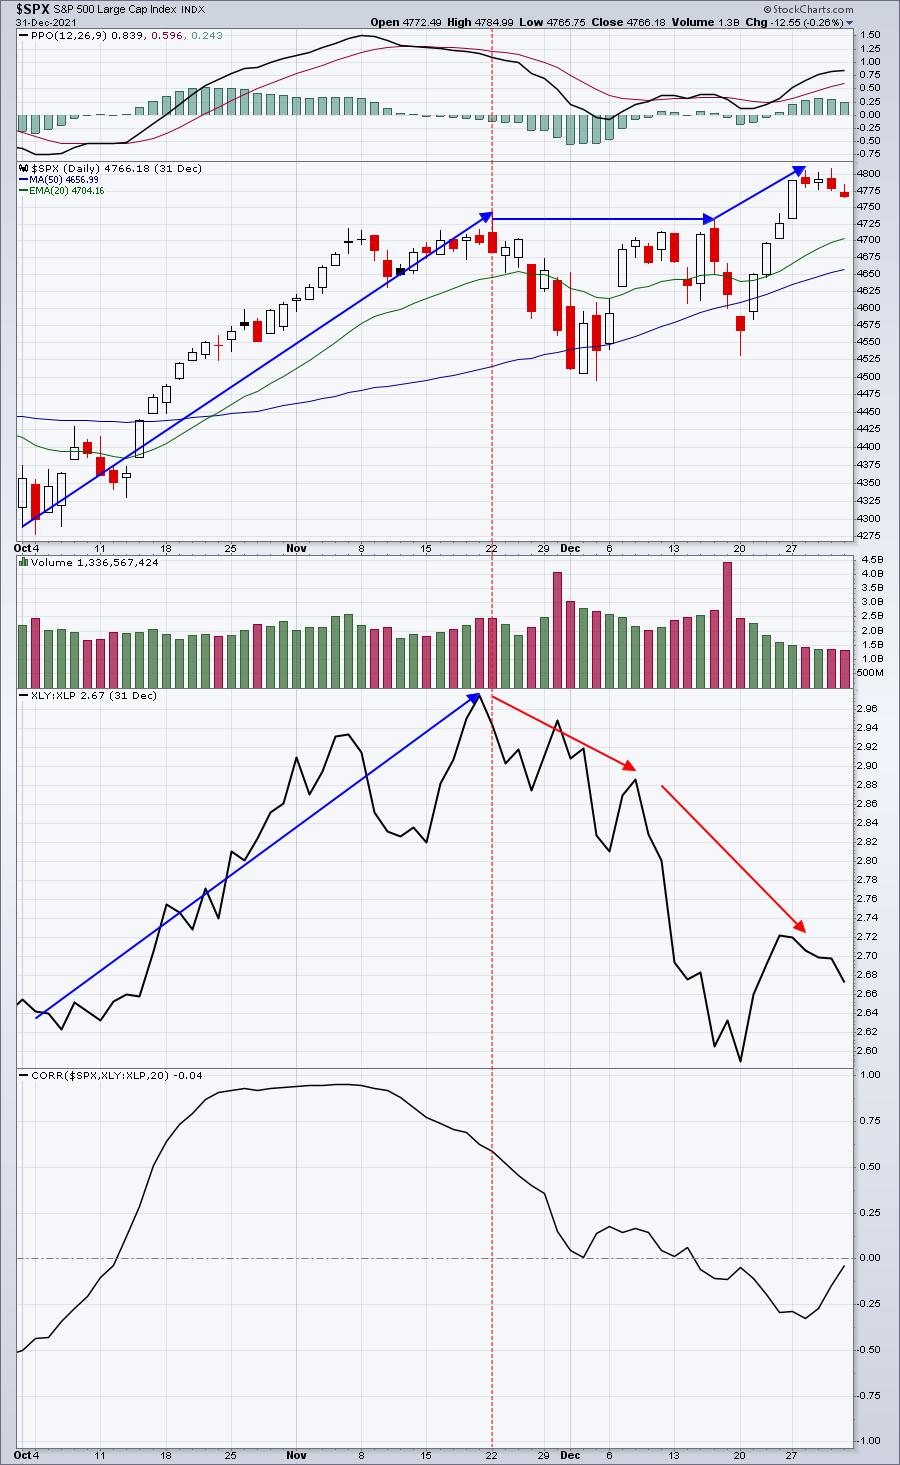
The inverse correlation is reflected in that bottom panel. Wall Street was rotating from the aggressive discretionary sector to the defensive staples sector throughout the ENTIRE MONTH OF DECEMBER! Did they tell you? Did they tell CNBC? Nope. I'm pretty sure they were telling us how high everything was headed. This is why you MUST ignore the media and follow the charts.
By the way, I wrote an article on December 31, 2021 - just prior to the January 4, 2022 market top - that pointed this out. In fact, here was the 1-month sector performance chart as of December 31st:
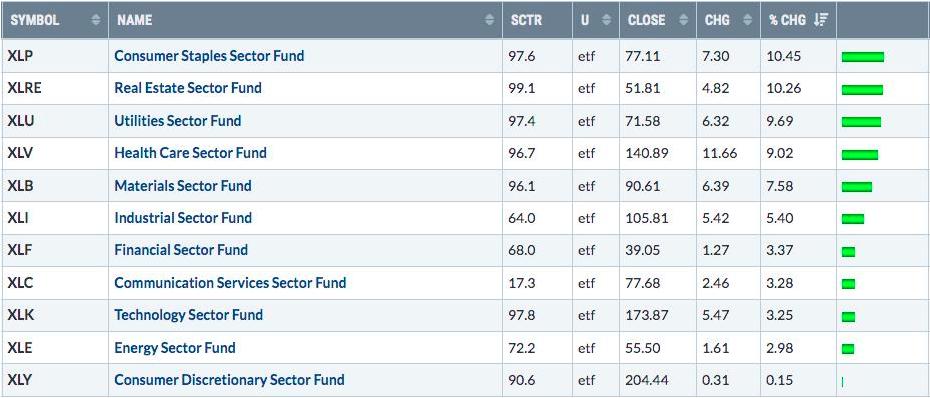
Look at this 1-month performance from December 2021 and compare it to the most recent 1-month performance that I provided earlier in this article (scroll back up). It's like they've been flipped upside down. Wall Street is NOW buying these aggressive areas hand over fist. Yet, I still see articles discussing this "bear market rally". LOL!!!! Bear market rallies were in fashion in the first half of 2022, but they're in the rear view mirror. Money rotated back into discretionary at the June bottom and it was one of the several reasons that I called the bottom on June 16th. Look at this chart:
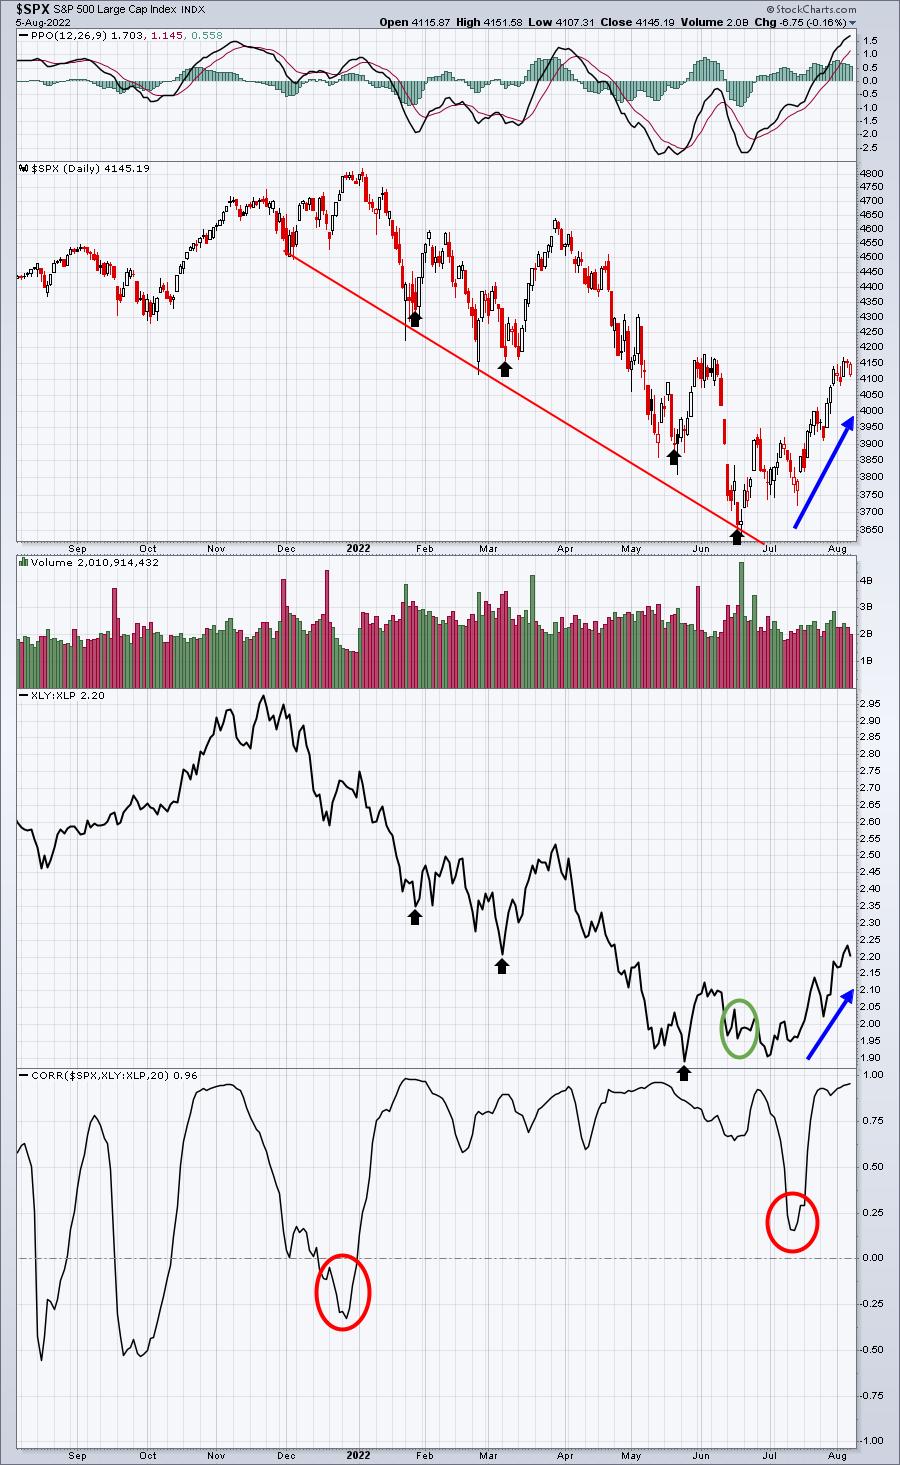
Every earlier low in 2022 (black arrows) was accompanied by a lower low in the XLY:XLP, suggesting that all prior rallies were likely to be short-lived. Then enter June. That green circle highlights the fact that as the S&P 500 moved to a fresh new low in June, Wall Street began rotating into discretionary stocks as the XLY:XLP ratio failed to produce a lower low. There were other bullish signals at the bottom as well, including the final "reset" of sentiment that I called for back in December. The cyclical bear market was OVER in mid-June. I'm not Monday-morning quarterbacking here. Watch my video that called the bottom on June 16th for the list of reasons why I saw the tide turning:
"I'm Calling the Bottom in the S&P 500"
Announcing a Huge FREE Event
Given the crazy volatility that we've experienced in 2022, I think it's appropriate to revisit a number of key areas to help us determine likely market direction and targets for the balance of 2022. So we've added a new FREE event to our calendar -
Event: Where Does The Market Go From Here?
Date: Saturday, August 27th
Time: 10:00am ET
This is a FREE event, but you must register! For more information and to save your seat, simply CLICK HERE and enter your name and email address in the area provided. We'll take care of the rest!
Happy trading!
Tom


