One of my favorite intermarket relationships exist between consumer discretionary (XLY) and consumer staples (XLP). It's a very quick way to see whether the stock market favors offense or defense. If the XLY:XLP ratio is rising, it's a signal to me that Wall Street believes prices are going higher. The opposite is true when the XLP is leading. If we use the correlation coefficient, we'll see just how solid this ratio can be:
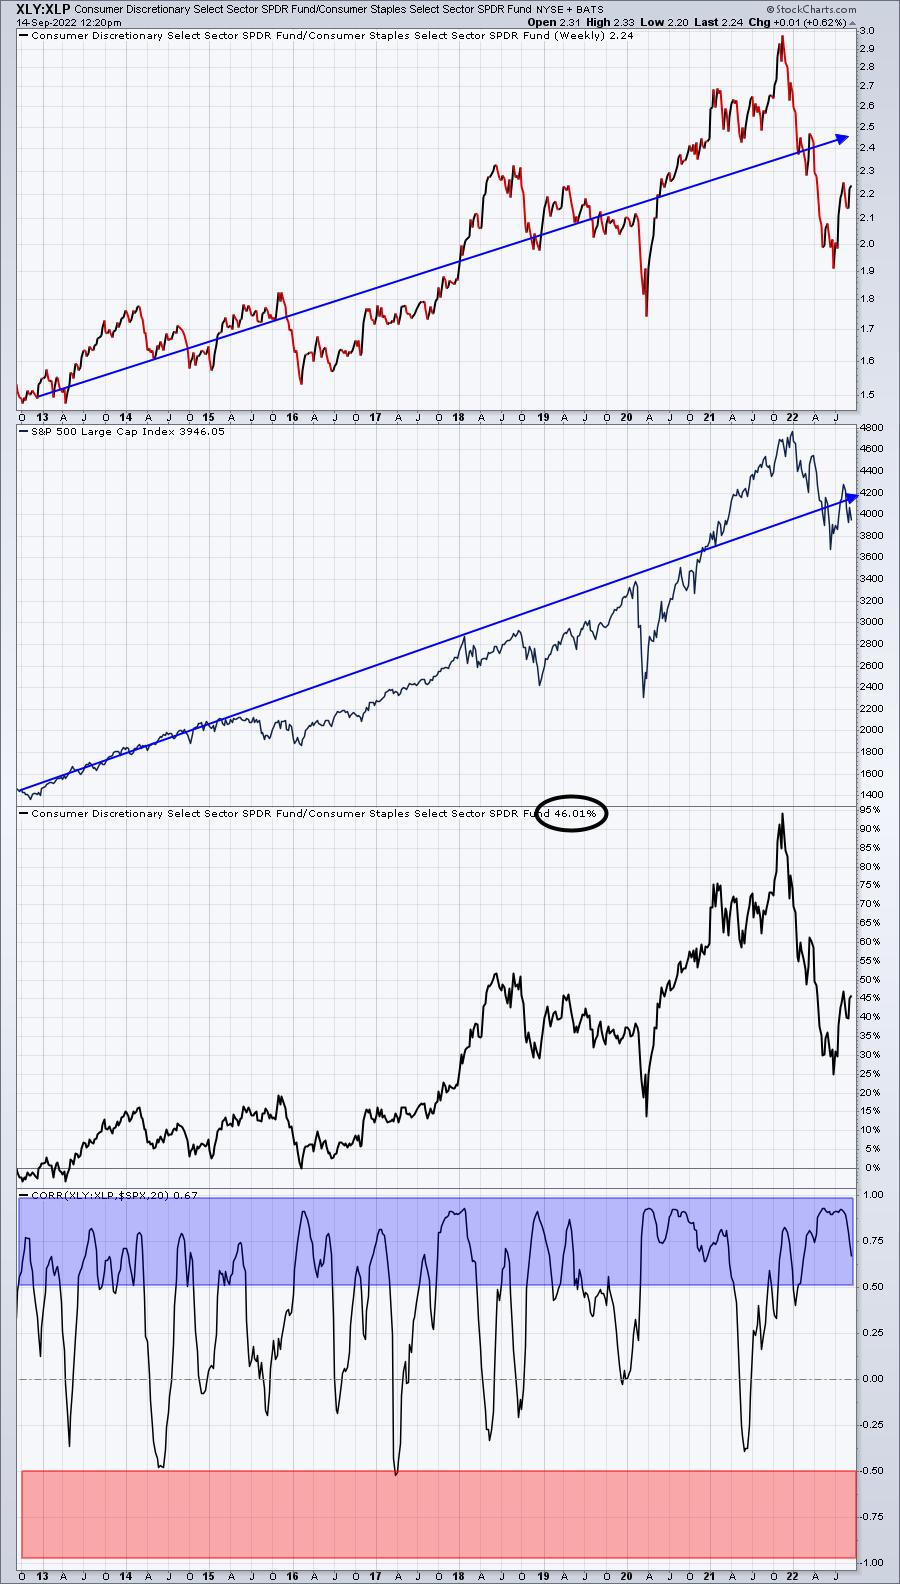
Correlation spends plenty of time between +0.5 and +1.0, which is very strong positive correlation. Meanwhile, look at how often the XLY:XLP ratio shows inverse correlation in the -0.5 to -1.0 area. Essentially, zero times during the 10 years of this secular bull market. It should be fairly clear based on this visual that the XLY:XLP ratio is tightly and positively correlated with the S&P 500.
I've had many traders say that using the XLY isn't representative because Amazon.com (AMZN) and Tesla (TSLA) are so heavily weighted. Their argument is that this isn't a "true" measure. Really? So it makes more sense to equally weight companies that are "gnats" compared to these two "800-lb gorillas"?
Here are a few numbers to consider:
TSLA:
- Revenue (trailing 12 mos): $67 billion
- Quarterly Revenue growth: 41.60%
- EBITDA: $14 billion
- Quarterly Earnings growth (year over year): 97.80%
- Full-time employees: 99,290
AMZN:
- Revenue (trailing 12 mos): $486 billion
- Quarterly Revenue growth: 7.20%
- EBITDA: $52.6 billion
- Quarterly Earnings growth (year over year): N/A
- Full-time employees: 1,523,000
These two companies are EXTREMELY important to our economy. They are two of the most visible discretionary companies and weakness in either (or both) of them would be a devastating blow to consumer discretionary, the S&P 500, the NASDAQ, and to our economy.
Now let's pick two other random consumer discretionary companies from the small cap list:
Tuesday Morning Corp (TUES):
- Revenue (trailing 12 mos): $765 million
- Quarterly Revenue growth: 4.10%
- EBITDA: -$21.4 million
- Quarterly Earnings growth (year over year): N/A
- Full-time employees: 1,607
Zovio Inc. (ZVO):
- Revenue (trailing 12 mos): $230 million
- Quarterly Revenue growth: -25.70%
- EBITDA: -$38.4 million
- Quarterly Earnings growth (year over year): N/A
- Full-time employees: 1,365
So let me ask you this question. How many of you check the charts of TUES and ZVO when you're evaluating the strength of the stock market? Well, if you cling to the equal-weight theory, you are saying that the prospects and performance of TUES and ZVO are just as important as TSLA and AMZN. How crazy ridiculous is this? The last time I checked, the S&P 500 is market-cap weighted, as is the NASDAQ. What relevance does the equal-weighted version of the XLY:XLP have?
The equal-weighted version, by the way, is RCD:RHS. Let's check out this chart and see how it's performed over the past 10 years.
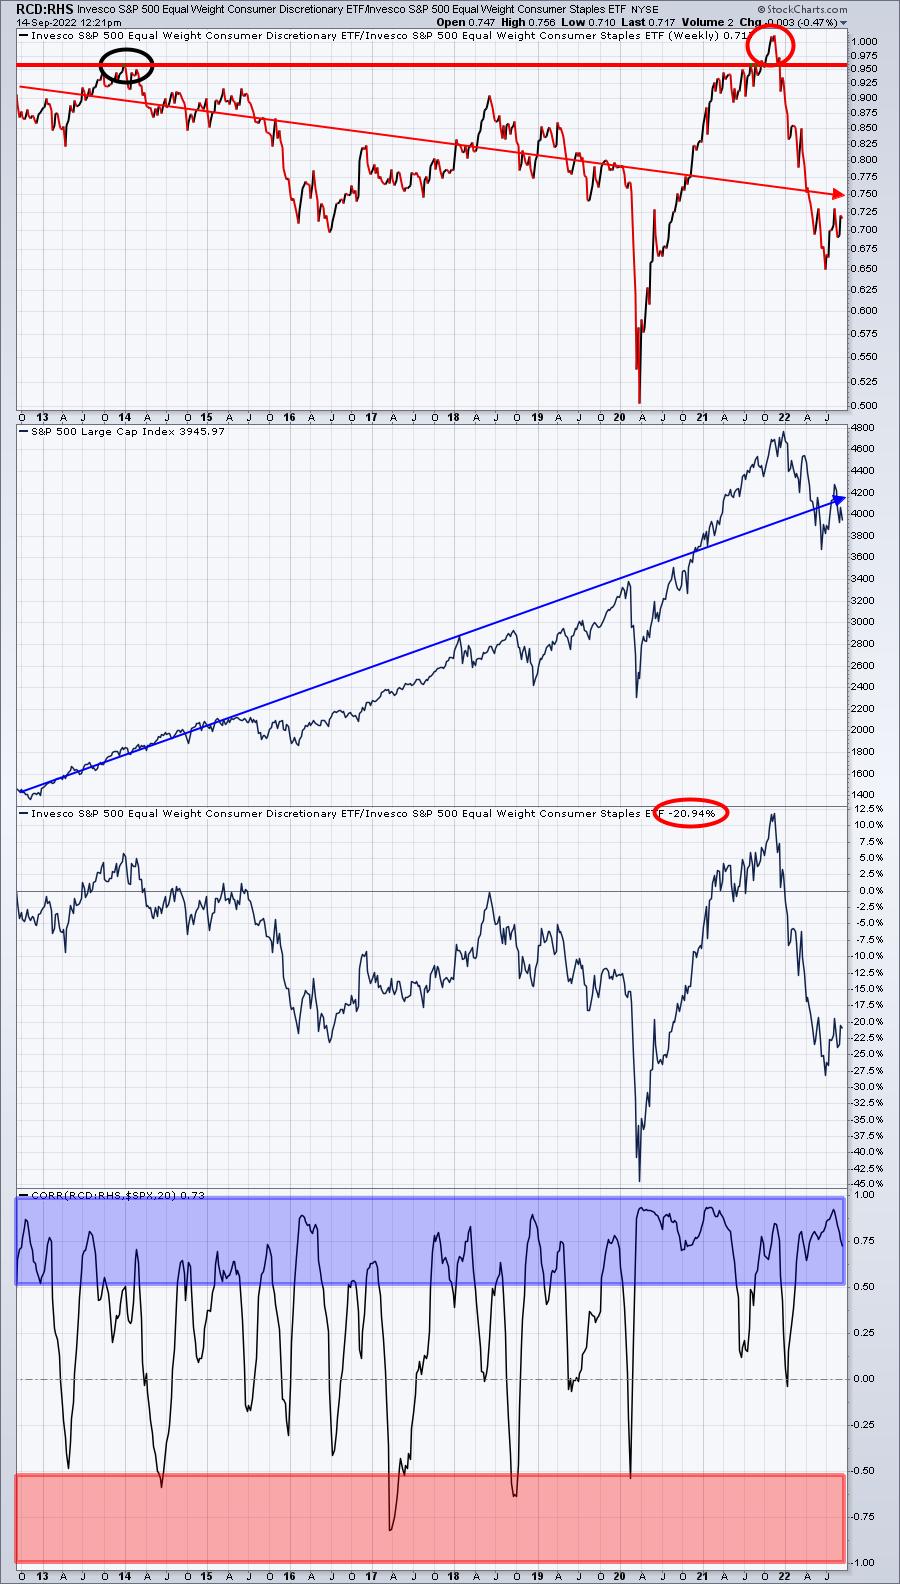
The overall short-term correlation here is mostly positive (though not as positive as the XLY:XLP) because we have 20-week look-back periods. But if you're waiting for the RCD:RHS ratio to break out to highs above the 2014 high, you'd have been waiting a long, long time. And guess what happened when it finally did break out? The S&P 500 fell apart.
I've had many tell me that the XLY:XLP ratio isn't a good signal to evaluate the health of the stock market, yet it continues to print higher highs and higher lows - just like the S&P 500. In the meantime, how have those RCD:RHS signals (no breakout confirmation) worked out? It had never broken out (until 2021), never confirming the 10-year secular bull market advance. If you're waiting for strength in this RCD:RHS ratio to validate the bull market, I wish you the best of luck.
Give me trading liberty (TSLA and AMZN), or give me investing death (breadth).
If you're interested in joining our FREE EB Digest newsletter (no credit card required), CLICK HERE.
Happy trading!
Tom


