I made a bold bottoming call on June 16th, just prior to a massive 700-point rally in the S&P 500. I didn't see the recent drop and double-bottom coming, however. Now that we've seen it, has anything changed? Are my signals still bullish? For me, nothing really has changed. There's been a slight deterioration in my sustainability ratios, but overall, I remain as bullish as ever. I believe the riskiest position right now is to remain short or in cash. At the beginning of the year, I said the riskiest position at the time was being long. Here's a quick look at the S&P 500, with several key ratios reflected in the panels beneath:
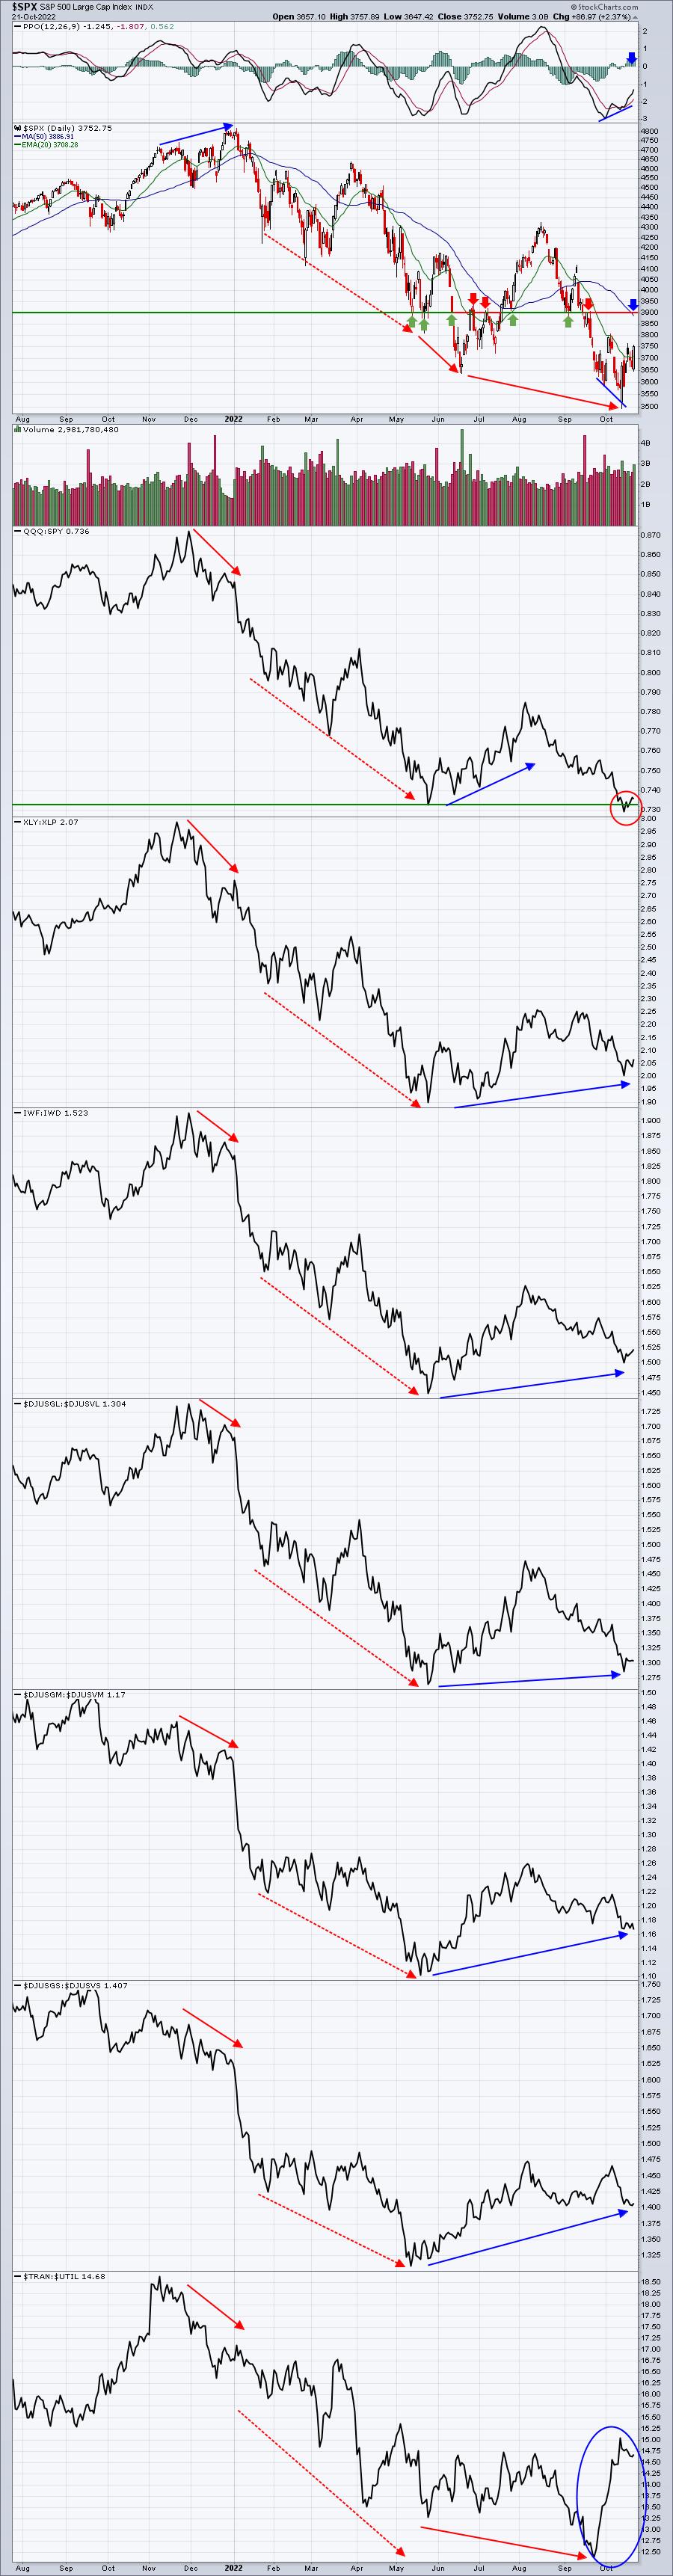
As a refresher, the top formed as Wall Street firms rotated to defensive- and value-oriented areas of the market. The exact opposite has been occurring since May. Ignore it at your own peril. The QQQ:SPY ratio did make a new low (red circle), so that's the primary deterioration that I referred to earlier. The TRAN:UTIL ratio, however, has been surging higher lately (blue oval), so there's a bit of an offset there.
All of my other ratios are higher than they were in May/June and reflect Wall Street's desire to own more aggressive- and growth-oriented areas of the market. How can we interpret that as anything but bullish? If you ignored the topping signals, it should have been a lesson learned. I believe ignoring the current signals will only compound the first error.
The positive divergence (higher PPO with lower price) suggests an initial trip to 3900, which has proven to be a formidable resistance level. Last week, monthly options expiration was pointing to a strong week potentially for equities and the S&P 500 jumped 4.74%. The NASDAQ 100 ($NDX) spiked 5.78%. The weekly positive divergence on the NDX suggests a possible return trip to the August high:
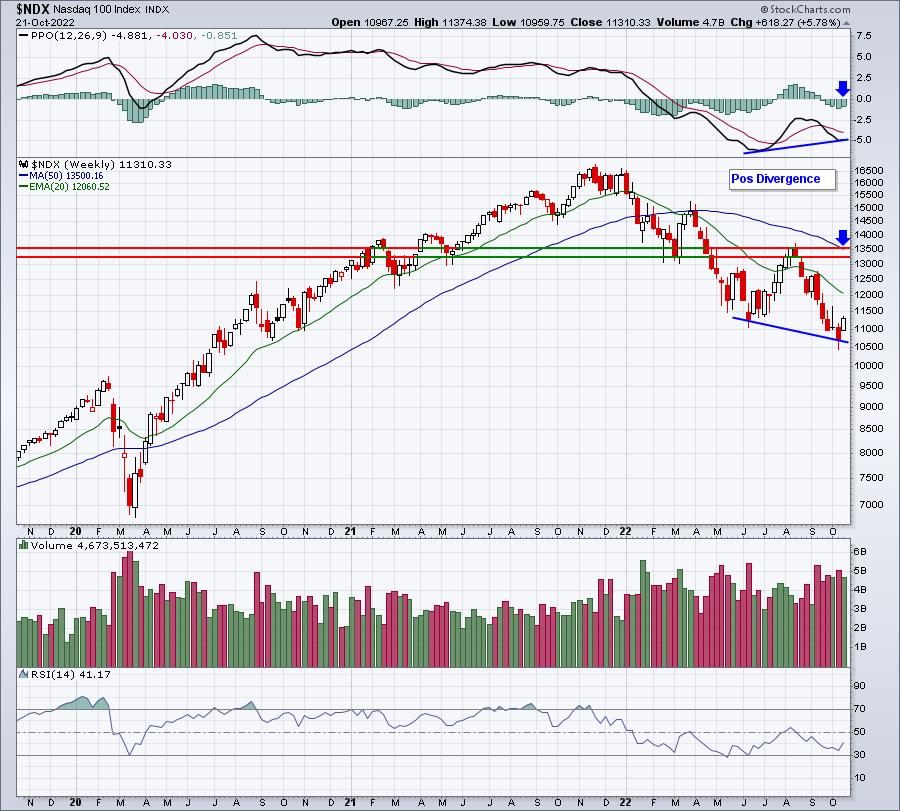
In my experience, when I see a positive (or negative) divergence, I look for a PPO centerline "reset" and/or a 50-period SMA test. That's where I've placed those blue arrows above and what I would expect here. Is it a guarantee? Of course not. I'm talking probabilities here.
There is one significant bearish consideration this week, however. The period from the October 21st close (Friday) to the October 27th close (this Thursday) represents the absolute worst week historically on the S&P 500 and NASDAQ 100 since 1950 and 1971, respectively. Here are the annualized returns of the NASDAQ 100 since 1971 by calendar day this week:
- October 24 (Monday): -72.45%
- October 25 (Tuesday): -47.26%
- October 26 (Wednesday): -84.53%
- October 27 (Thursday): -73.38%
I've been asked on occasion to explain how these numbers are calculated. I take all the October 24th trading days since 1971 (there have been 36 of them) and add the daily percentage gains/losses together and divide by 36 to get the average daily return. There are typically 253 trading days in a calendar year, so I take that average daily return and multiply by 253. If we do see historical weakness surface again this week, I believe it will provide us an EXCELLENT entry opportunity into some of our favorite stocks.
On Monday, I will provide one such growth stock in our FREE EB Digest newsletter that has hit significant long-term price support AND key channel support. Its risk reward profile is excellent and could lead to substantial profits, though it is an aggressive trade. If you're interested in learning more about this potential trade, CLICK HERE and provide your name and email address. We'll get you set up and be sure to send you that stock first thing in the morning. There is no credit card required and you may unsubscribe at any time.
Happy trading!
Tom


