I always stress the importance of combining technical and fundamental analysis. I practiced in public accounting for more than 20 years, with most of that time spent at a large, regional CPA firm in the Washington DC area. While I believe technical analysis is an absolute necessity to observe price/volume trends, perform relative strength analysis, and find appropriate entry and exit points in individual stocks using technical tools, there is also no substitute for a company's management that beats competitors and excels in producing results that exceed Wall Street's expectations. Accelerating revenue and earnings growth leads to higher multiples and, ultimately, bigger and faster profits for traders. Using an investing or trading strategy that combines both is paramount to wealth accumulation, in my opinion.
But there's a third supplementary ingredient that should be added as well. You need to understand seasonal influences that can drive stock prices higher. The seasonality tool here at StockCharts.com is quite likely underused. I spend a great deal of time researching seasonality and even produce a monthly seasonality report for members each month. If you'd like to see our October Seasonality report, check out the offer in the last paragraph of this article below. I rarely use seasonality as the reason to buy or sell a stock. Rather, I use it to confirm the technical and fundamental reasons I'd want to buy or sell a stock. Let me give show you how we've constructed our portfolios to benefit from strong periods and weather the more difficult times. Then I'll discuss how we include seasonality in our research.
Portfolio Construction
We just completed our Model Portfolio's 16th quarter of performance and our cumulative results have been stunning. By following our strategy of "technicals plus fundamentals plus seasonality", we've delivered results that are unmatched in the industry - all documented with quarterly video recordings where we've announced the 10 equal-weighted stocks included in the portfolio. We then track our portfolio results daily on our website. Our inception date for our Model Portfolio was November 19, 2018 and here are the results on an annual basis, relative to the benchmark S&P 500 and two very well-known ETFs, ARK Innovation (ARKK - Cathie Wood) and Innovator IBD 50 Fund (FFTY) which seeks to track results of the IBD 50 Index, Investor Business Daily's signature investing tool):
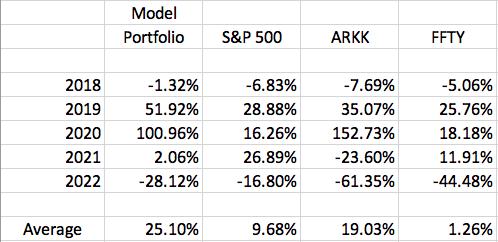
While ARKK seems to be fairly close to us, just six percentage points lower, its ridiculously large drawdown in both 2021 and 2022 was devastating to investors. Assume you start with 100,000. Here's how your investment would have performed cumulatively from November 19, 2018 through November 18, 2022:
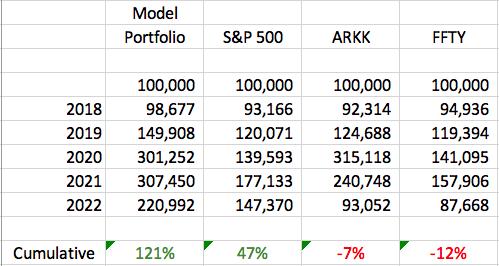
As great as Cathie Woods' ARK funds performed in 2019 and 2020, they gave it all back ... and then some during the last two years. Unfortunately, "confirmation bias" contributed to her and her funds' demise. While I completely agree with her that growth is the way to go for those willing and able to take on higher risk, she was shockingly unwilling to adjust her strategy during a nasty cyclical bear market. In the midst of a complete revaluing of growth stocks, you don't keep buying. It was a devastating mistake on her part and the damage has been done.
Our Model Portfolio (and our other two portfolios, Aggressive and Income) are constructed every 90 days, taking all new information (market environment, most recent earnings, the Fed, etc.) into account. Fortunately, we moved away from most growth stocks on February 19, our scheduled quarterly date to redesign our portfolios. Here's how we performed since that time and through Friday's close:
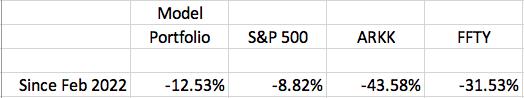
Despite still including some growth stocks, our Model Portfolio managed to stay fairly close to the S&P 500 Index and our Aggressive (-2.50%) and Income Portfolios (-5.00%) actually beat that benchmark since February 19. We adjusted our growth strategy to a mixed growth/value approach to help preserve capital during what would likely be a tumultuous period and await a much better time to invest more heavily in growth. It's paid off.
Cathie Wood, with 20/20 hindsight, made the same mistake that individual investors make and doubled, tripled, then quadrupled down. That's how behavioral biases—the inability to consider alternative strategies—work. She wasted a lot of people's money in the process.
Seasonality
First, it's important to understand the limitations of seasonality. Again, it's simply a confirming signal, not a primary one. We don't add stocks to our portfolios, because they have strong seasonal trends alone. But if we like a stock on a technical and fundamental basis and the company also shows strong seasonal tendencies for the upcoming period, then that can be a deciding factor. Consider ON Semiconductor (ON). As you can see from the chart below, it's been one of the best semiconductor stocks ($DJUSSC).
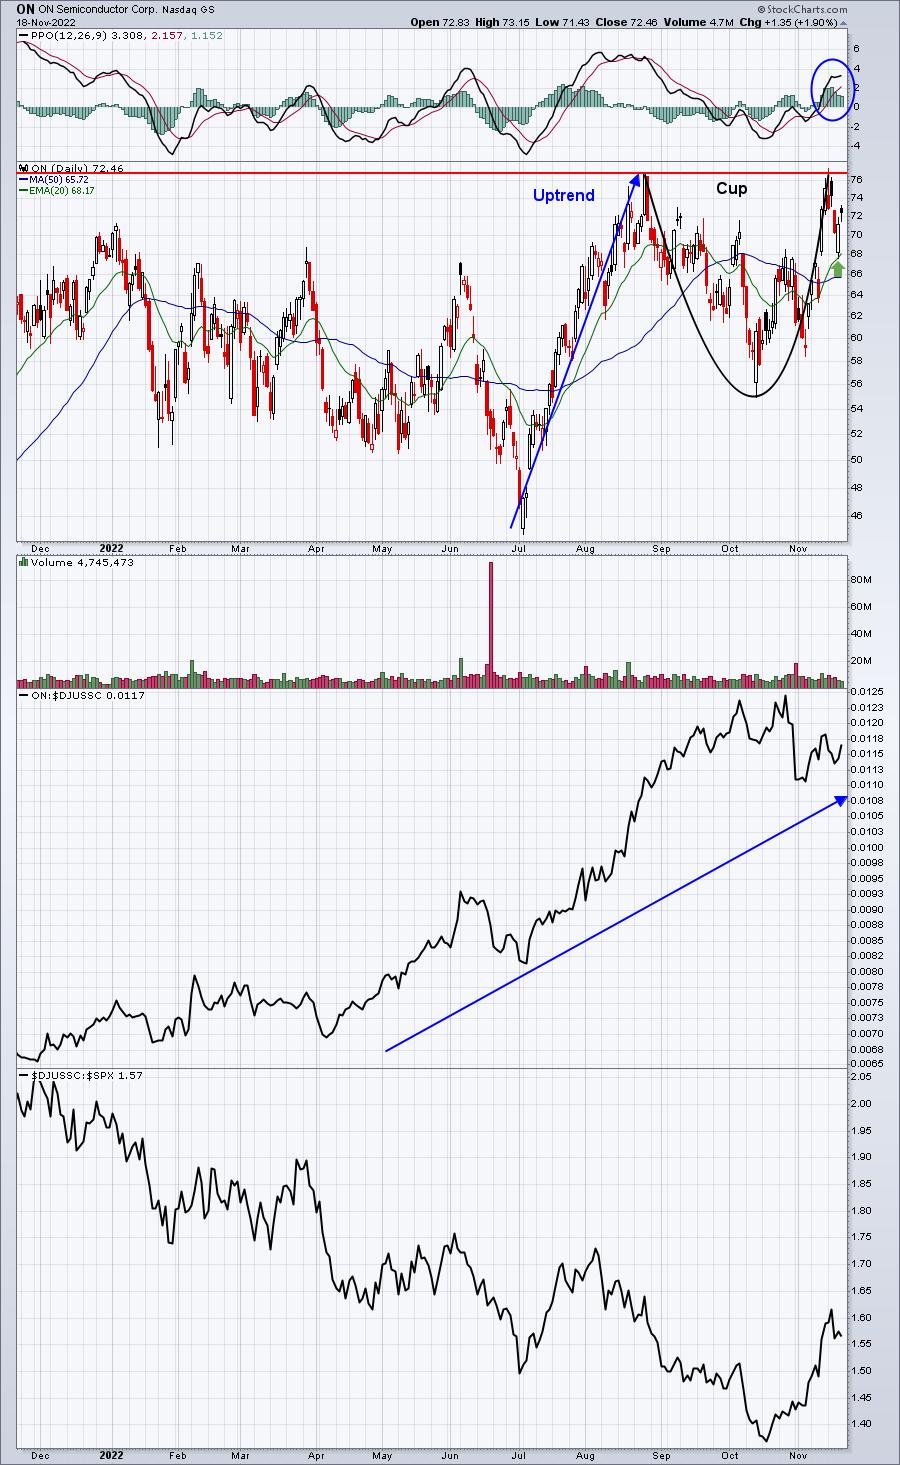
Then there are the fundamentals. Despite many semiconductors falling short of revenue and/or EPS estimates this past quarter, ON was able to easily beat both. Revenues were $2.19 billion vs. $2.12 billion and EPS came in at $1.45, well ahead of the $1.32 estimate. This is the type of company that will be rewarded when money rotates more and more back toward growth.
Now let's look at seasonality, first with the semiconductor industry:
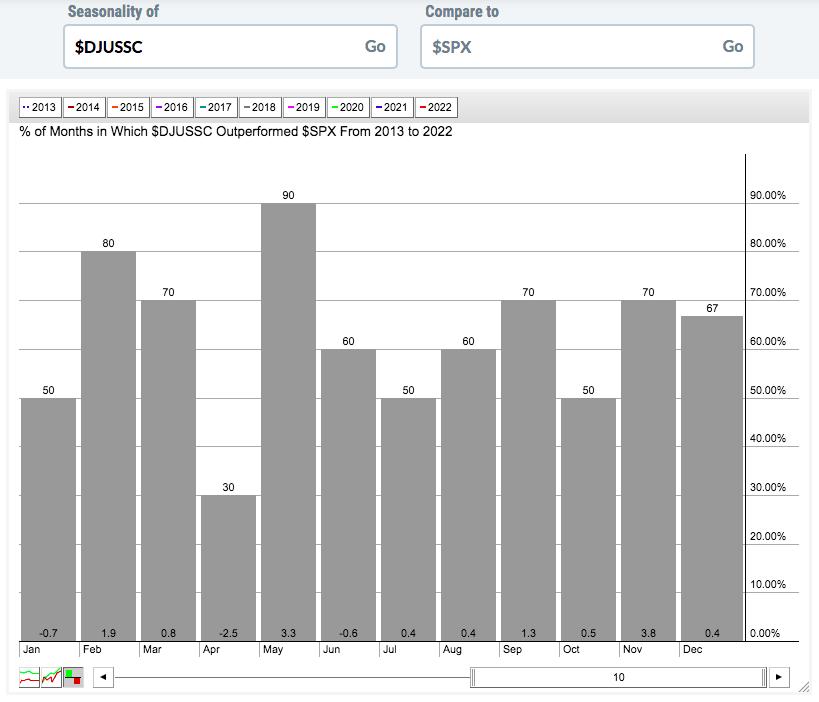
The $DJUSSC enjoys solid market behavior during the months of November to February, which covers our next Model Portfolio quarter (11/19 through 2/19). The average outperformance of the $DJUSSC vs. the S&P 500 Index is 5.4 percentage points during this period. Outside of May, this is clearly the strongest period of relative outperformance for semis since 2013, the start of our current secular bull market. I treat 2013 as the start rather than 2009, because we didn't clear the double top on the S&P 500 Index from 2000 and 2007 until April 10, 2013. ON really loves this time of year. Check out ON's seasonality chart:
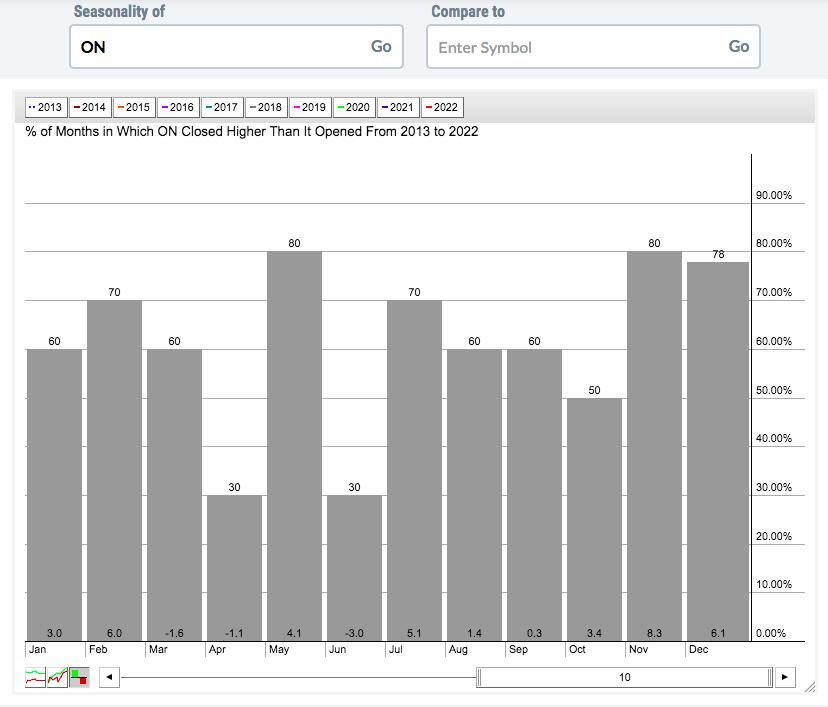
ON has averaged gaining 23.4% during the November to February period throughout this secular bull market. During the other eight months, ON has averaged gaining just 8.2%. If growth stocks return to favor, as I expect them to, ON could see a very big move over the next few months.
On Monday, I'll be providing our FREE EB Digest subscribers another stock poised to benefit from seasonal tailwinds in the next quarter. It's a second stock included in our current Model Portfolio. I'll give you a hint. This company has enjoyed an AVERAGE RETURN of more than 20% from December 31st through February 19th since going public in 2002. THAT is an average of a 20% gain over just a 50-day period - a crazy strong seasonal tendency! CLICK HERE to join our EB Digest newsletter with just your name and email address. There is no credit card required and you may unsubscribe at any time.
Finally, our BEST DEAL of the year is underway. Check out our Fall Special and the significant savings by clicking the link. We will not offer a better deal to join EarningsBeats.com, so be sure to check it out NOW!
Happy trading!
Tom


