There's a great debate as to whether we've seen the market bottom. I'm firmly in the camp of "YES, we've seen it." I called a bottom in mid-June and, if it weren't for FedSpeak from Jackson Hole in August, I believe that bottom would have held. As it is, we only saw a brief move beneath that June low earlier this quarter before the latest rally took hold.
I also believe that the stock market is heading higher during the balance of December, as it usually does. Historical trading behavior in December is a bit odd as the second half of the month crushes the first half of the month. Here are the annualized returns on the S&P 500 since 1950 during the two distinct halves of December:
- December 1-15: +2.82% (51.05%)
- December 16-31: +35.68% (58.03%)
The percentage of days within the period that saw the S&P 500 move higher is within parentheses. So you can see that the odds of any day within these two periods moving higher are much better in the latter half of the month. Combining that with the annualized returns makes it quite clear that the bulls truly own the second half of December.
Now let's take another look at a historical December breakdown. In the following table, I'll show you how many times December has been an up month vs. down month since 1950, or the past 72 years. Below this monthly performance, I'll break down the month into 3 different periods and show you the rise vs. fall tendency of each:
- December (entire month): 54 (up) vs. 18 (down)
- December 1-6: 46 vs. 26
- December 7-15: 33 vs. 39
- December 16-31: 57 vs. 15
Again, the historical tendencies shine through rather obviously. December is a great month for U.S. equities, but be careful during that second week. Once we get past the 15th, however, it's typically full speed ahead.
If we do rise into year-end, should we expect growth stocks to lead the way? Well, a lower interest rate environment could play into this scenario, but history would say NO. The IWF is an ETF that tracks large-cap growth stocks, while the IWD is an ETF that tracks large cap value stocks. Using the Seasonality Chart at StockCharts.com, we can plot the relative historical performance for the IWF vs. the IWD (IWF:IWD). Check this out:
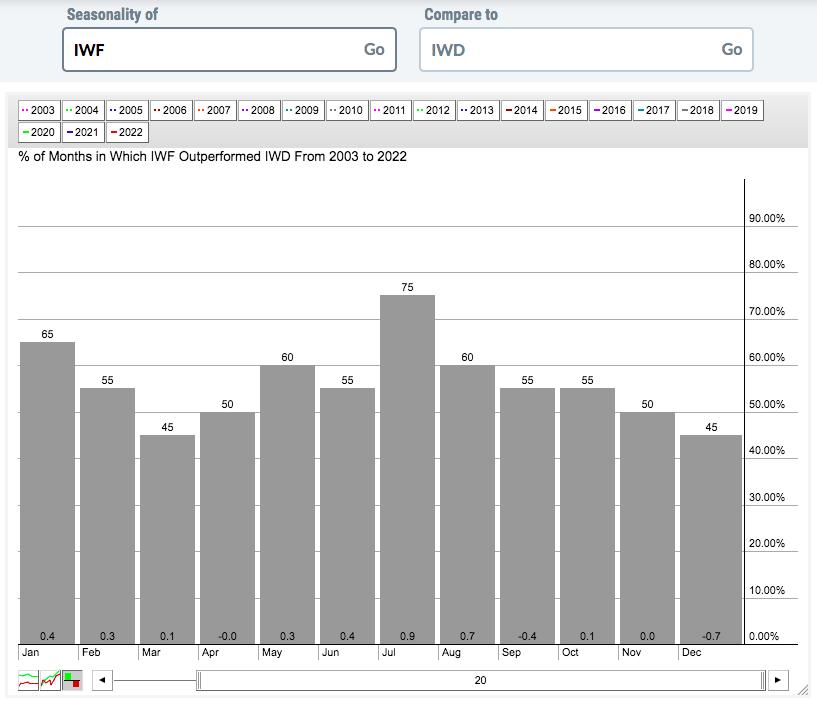
The IWF has outperformed the IWD during December 9 of the last 20 years, or 45%. But the IWF has averaged underperforming the IWD by 0.7% over the past two decades, which is the IWF's worst relative performance among the 12 calendar months.
Value stocks really love Q4 and that love affair only grows stronger as the quarter wears on. Check out this 20-year track record of the IWD and add up those average monthly returns by quarter. First, I'll show you the seasonality chart and then provide a table that summarizes the quarterly performance:
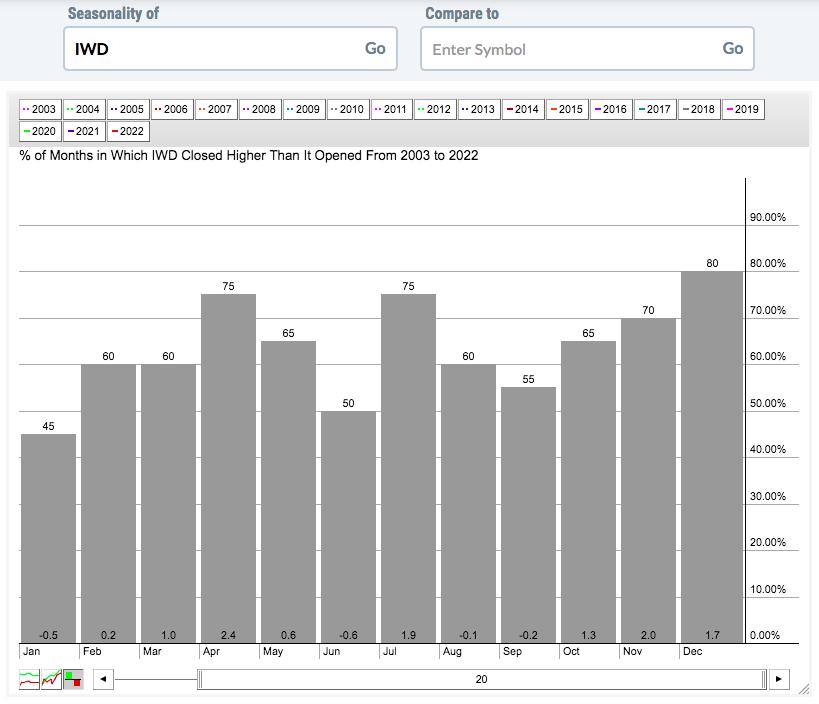
Now for the quarterly breakdown:
- Q1: +0.7% (add January's -0.5%, February's +0.2%, and March's +1.0%)
- Q2: +2.4%
- Q3: +1.6%
- Q4: +5.0%
Large cap value stocks have gained an average of 9.7% over the past 20 years, but more than half of those gains have been earned during Q4 and December is clearly one of its best calendar months. Ignore this area of the market at your own peril.
Given the December tendencies, I certainly would not give up on the value stocks, even if rates do continue to drop (which would favor growth stocks). On Monday, I will feature one value stock in our FREE EB Digest newsletter that LOVES the month of December and looks poised to take full advantage as its technical picture is very strong as well. CLICK HERE to provide your name and email address and subscribe. There is no credit card required and you may unsubscribe at any time.
Happy trading!
Tom


