Quarterly earnings is a time when management teams announce whether they've kept all their promises that were made over the prior 90 days. These quarterly earnings announcements shouldn't be shockers. Investors despise big surprises, especially when companies fall short of their consensus estimates. Wall Street firms use future earnings estimates and projected growth rates to help them determine the inherent values of businesses. When management teams can't meet or beat current estimates, how can their future estimates be trusted? And once Wall Street loses trust in management, it's over. It can take a long, long time to restore that confidence.
An Earnings Indicator
My "go-to" indicator in terms of earnings, and you've likely heard me talk about it often, is relative strength. Using a school analogy, teachers separate their best students from their worst students using grades. Students that routinely make As are considered excellent students, while C students are considered average, and those making Fs are failing, unable to keep up with the better-performing students.
The stock market isn't much different. Wall Street firms break down companies in a given industry and much of their "grade" for each company is based on expected quarterly earnings and a company's history of beating estimates. As a trader or investor, you can get clues as to what to expect from quarterly earnings by how various companies' stocks trade relative to others within their industry group. In other words, are they the A students or F students, or somewhere in the middle?
Here are two perfect examples of stocks that just reported this past week, one with excellent relative strength and the other much weaker.
JP Morgan (JPM)
JP Morgan reported Q4 earnings on January 13, 2023.
- Quarterly revenues: $34.55 billion (actual) vs. $33.95 billion (estimate)
- Quarterly earnings: $3.57 (actual) vs. $3.11 (estimate)
Simply put, JPM crushed it. And Wall Street was expecting them to crush it. Money has been pouring into JPM relative to its banking peers for the past few months. How would you know that? Check out the chart below.
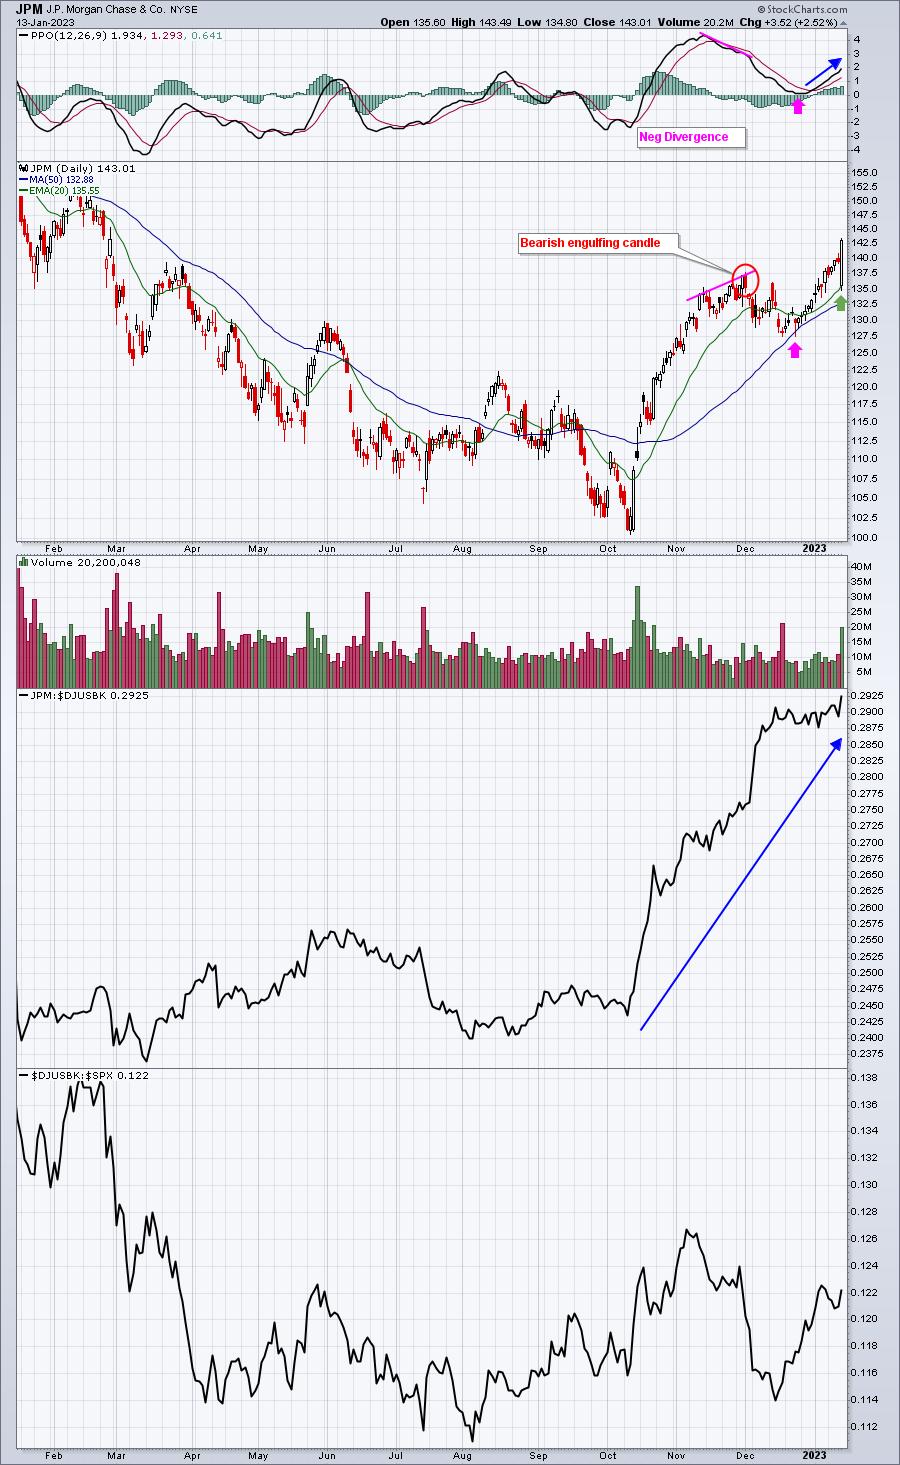
CHART 1: AN ANALYSIS OF JPM FROM AN EARNINGS PERSPECTIVE. The relative performance of JPM against the Dow Jones US Banks Index ($DJUSBK) has been trending sharply higher since October 2022. Chart source: StockCharts.com. For illustrative purposes only.
In my view, this is absolute textbook TA. JPM was a favorite among the big Wall Street firms, showing tremendous strength, both absolute and relative, from the October low through early December. But note the negative divergence that developed between the percentage price oscillator (PPO) and price at the end of 2022, when bullish momentum appeared to be waning.
Then, on the first trading day of December, JPM printed a bearish engulfing candle, which is a reversal candlestick pattern. Reversal candlesticks, combined with negative divergences, are signals you shouldn't ignore. I expect to see PPO centerline "resets" and/or 50-day simple moving average (SMA) tests after those bearish technical signals surface. The two pink arrows mark the PPO centerline reset and the 50-day SMA test, ending the three-week period of profit-taking/weakness. Since that time, JPM has resumed its prior uptrend and has a strengthening PPO—very bullish technical behavior.
Strengthening PPOs typically result in 20-day exponential moving averages (EMAs) acting as solid support on pullbacks. After JPM's quarterly results on Friday, a "sell on the news" mentality kicked in and banks were very weak Friday morning. JPM fell back initially to test that rising 20-day EMA, then bounced beautifully, closing back at its highest level since February 2022.
Excellent relative strength was the earnings indicator that suggested JPM could see solid quarterly earnings. It would have been wise to listen.
KB Home (KBH)
KB Home reported Q4 earnings on January 11, 2023.
- Quarterly revenues: $1.94 billion (actual) vs. $1.99 billion (estimate)
- Quarterly earnings: $2.47 (actual) vs. $2.85 (estimate)
Some might say, "how could you see this coming?" Well, one look at relative strength and you'd have to at least consider the possibility that quarterly earnings weren't going to be good (see chart below).
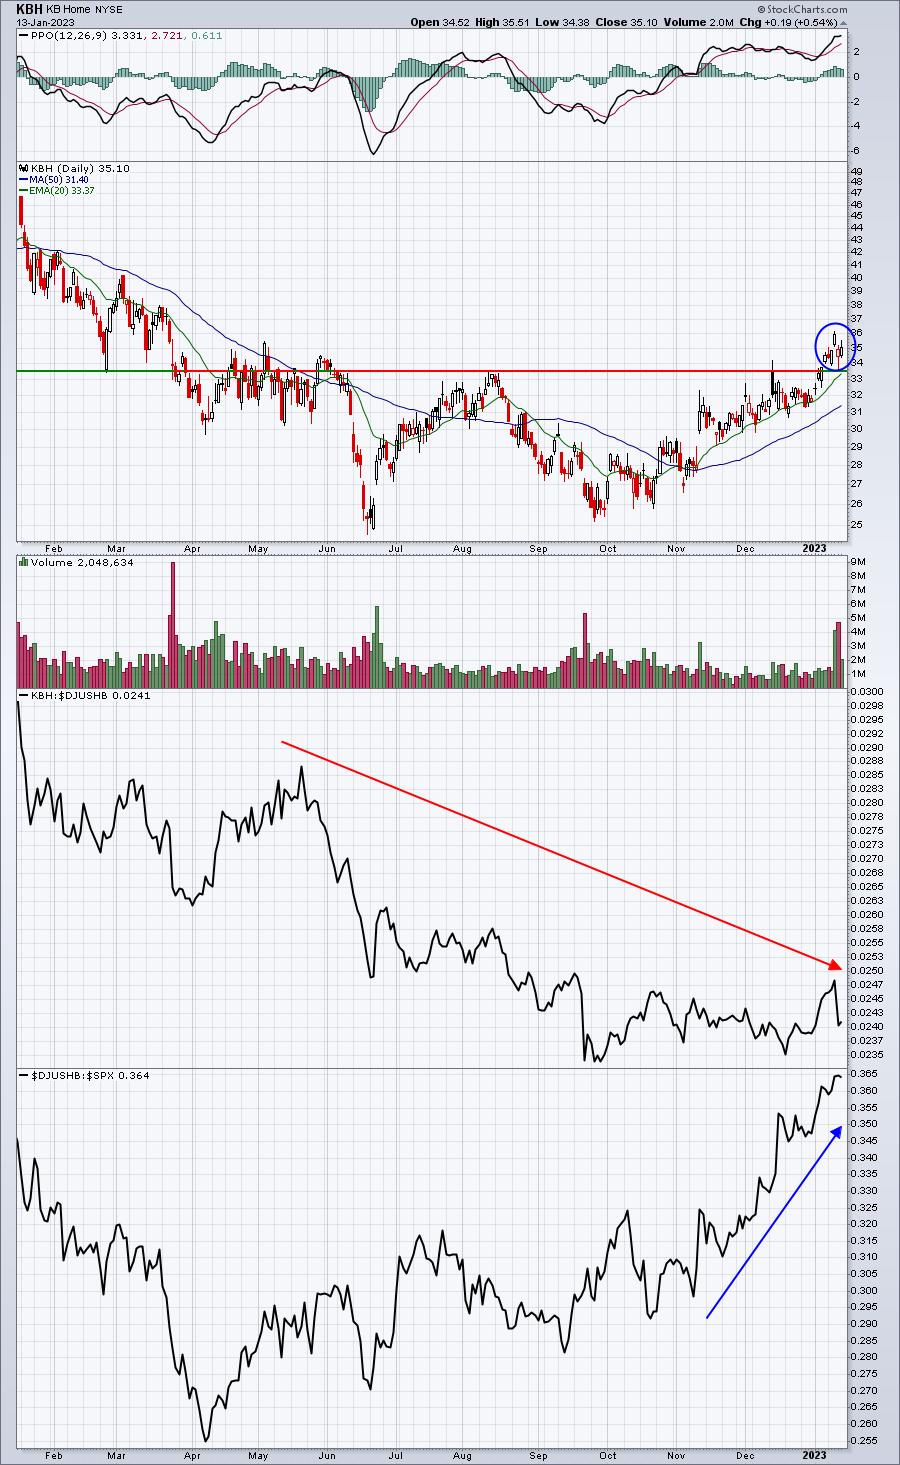
CHART 2: TECHNICAL ANALYSIS OF KB HOME. Although home builders have seen strong performance relative to the S&P 500 index, KBH's relative performance with respect to the Dow Jones US Home Construction Index (DJUSHB) has been trending lower since May 2022. This relationship can provide clues ahead of earnings. ChartSource: StockCharts.com. For illustrative purposes only.
If you just looked at stock price action, you would think that the recent price breakout would indicate that KBH would report strong quarterly earnings. There's a chance that KBH is a beneficiary of a very strong home construction group ($DJUSHB). Money has rotated strongly into homebuilders and KBH, despite being a relative laggard, has benefited from that inflow. This is a case of a strong group masking a weak component stock. The relative strength of KBH has been poor for a long time and this earnings indicator nailed another prediction beautifully as KBH missed on both its revenues and EPS.
I'm hosting a FREE "Q4 Earnings: Sneak Preview" webinar on Monday at 4:30pm ET where I'll be providing several upcoming earnings predictions based on relative strength. Results from last quarter were fantastic! If you'd like to join me, it only requires a FREE EB Digest newsletter subscription. We'll be sending out room instructions to all of our EB Digest subscribers on Monday. CLICK HERE to enter your name and email address and join me, if you're not already an EB Digest subscriber. There is no credit card required and you may unsubscribe at any time.
Happy trading!
Tom


