Ultimately, breaking out above the August 2022 high represents the key level to reverse the downtrend that began in early-January 2022. I like to use longer-term charts to determine whether we're currently trending higher or lower, and right now the downtrend is firmly in place:
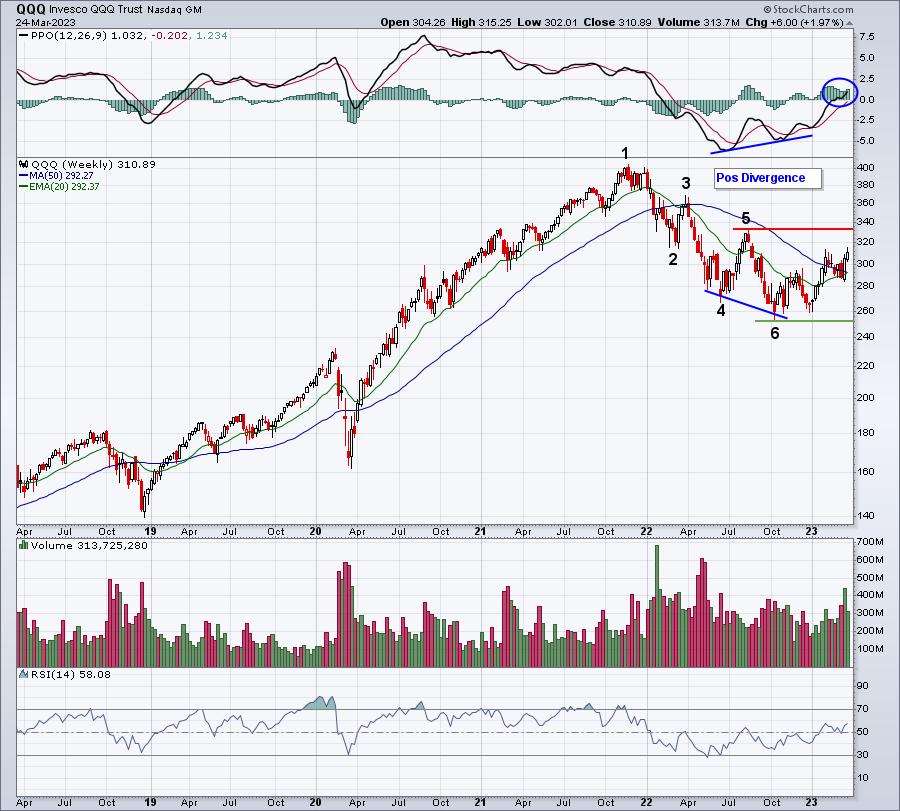
The numbers on the above chart identify the lower highs and lower lows that remain in play. Until we clear that August high, the price chart remains bearish. The problem is that if you wait until the long-term price chart turns bearish in a cyclical bear market (January through October 2022), you ride at least half, if not more, of the downtrend. The same holds true when bottoms form. If we're waiting for price confirmation - clearing overhead price resistance a little below 340 - we will have missed the first 30% or more of the move higher.
That's why I do what I do. The price chart only tells us so much. We must be aware of the "under the surface" signals taking place to truly understand the likelihood of a market advance of decline. Despite the clear downtrend on the chart above, I'm VERY BULLISH and have been since June 2022.
If you had $100,000 invested at the end of 2021 and you shorted the S&P 500 (bought SH) when we turned bearish at EarningsBeats.com, that $100,000 would have grown to nearly $125,000. On June 17, 2022, we called a market bottom. Investing that $125,000 in the SPY at that time would have grown to roughly $137,000 as of Friday's close. That would be a total 37% gain in the last 15 months, while the S&P 500 still remains 16.7% below its close on December 31, 2021. That type of outperformance vs. the S&P 500 is life changing, when you further consider the compounding nature of investment returns.
I've spent the past several months explaining to our EarningsBeats.com members why I believe the stock market is heading a lot higher. There are a number of reasons from the positive divergence that appeared on the above weekly chart to extreme bearishness in the options world to serious accumulation by Wall Street. Throw in a very strong seasonal period that begins this week and you'll begin to understand why I'm looking short-term at a breakout in the QQQ. We've been threatening and it wouldn't take much buying from here to clear overhead resistance on the daily chart:

Given the "under the surface" bullish signals, I'm simply waiting for the price action to confirm what I already believe is an uptrend that will result in all-time highs for our major indices later this year or early next. It will be spurred by growth stocks as the 10-year treasury yield ($TNX) continues to move lower.
I'll be featuring one industry group that will be a key leader during this next move higher. It's on the verge of its own breakout, one that will help to carry the NASDAQ much, much higher. If you'd like to receive this chart, simply CLICK HERE and sign up for our FREE EB Digest newsletter with your name and email address. There is no credit card required and you may unsubscribe at any time.
Happy trading!
Tom


