The normal relationship between the Volatility Index ($VIX) and the S&P 500 is an inverse one. The easiest way to illustrate this is to pull up a chart showing both and their correlation coefficient:
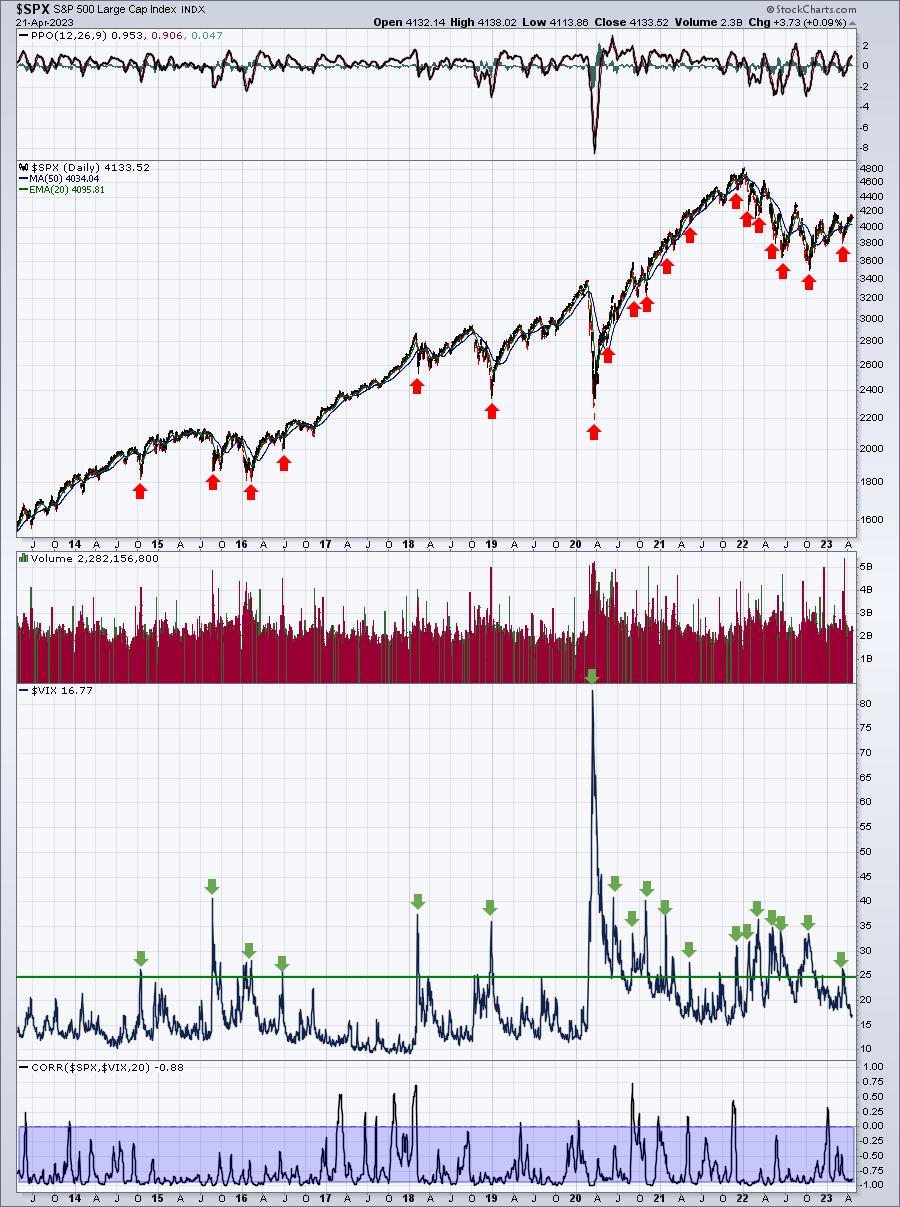
The red arrows mark bottoms in the S&P 500 and they generally coincide almost perfectly with tops in the Volatility Index. In the bottom panel, the correlation coefficient tells us whether the SPX and VIX are moving in the same direction (positive correlation) or in the opposite direction (inverse or negative correlation). The latter is highlighted by the blue-shaded area. It should be fairly obvious that the VIX and SPX almost always move in opposite directions.
To fully understand the VIX, you need to have a basic understanding of stock options and how they work and are priced. Options are contracts that give option buyers the right to buy or sell a stock at a predetermined price (strike price) on or before a specified day (expiration day). The pricing of options is dependent on a number of factors, but two of the most important are the volatility of the individual stock and the time remaining on the contract.
The value of the VIX is based on the "expected volatility" of the S&P 500 over the next month. As I pointed out in the chart above, the VIX typically goes up when the S&P 500 goes down (inverse correlation, remember the blue-shaded area). That tells us that expected volatility will be higher during market downtrends. And, because the VIX is based upon expected volatility over the next month, the lower the VIX goes, the more bullish the signal for the S&P 500. The biggest moves higher in the S&P 500 have historically occurred when the VIX is dropping and extended bull markets are associated with historically-low VIX readings.
When I look at sentiment, I only like two signals. One is the VIX, because it looks at how market makers are pricing S&P options, which provides us a clue as to what market makers are expecting over the next month. The second is the equity-only put-call ratio ($CPCE), because it provides us a feel for the psyche of the retail trader. The latter is the best contrarian indicator in the stock market, in my opinion. Its predictive abilities are astounding. But let's stick with the VIX here for this article.
Bear markets require a number of things, but one significant need is fear. The more fear we have, the more volatile the stock market is, and the higher the VIX. That's how it works. That's why we see VIX readings in the 30s, 40s, and 50s at or near the bottom of bear markets. In 2008, during the height of the financial crisis, the VIX spiked to 90! At the other end of the spectrum, however, are bull markets that see the VIX tumble all the way back to single digits.
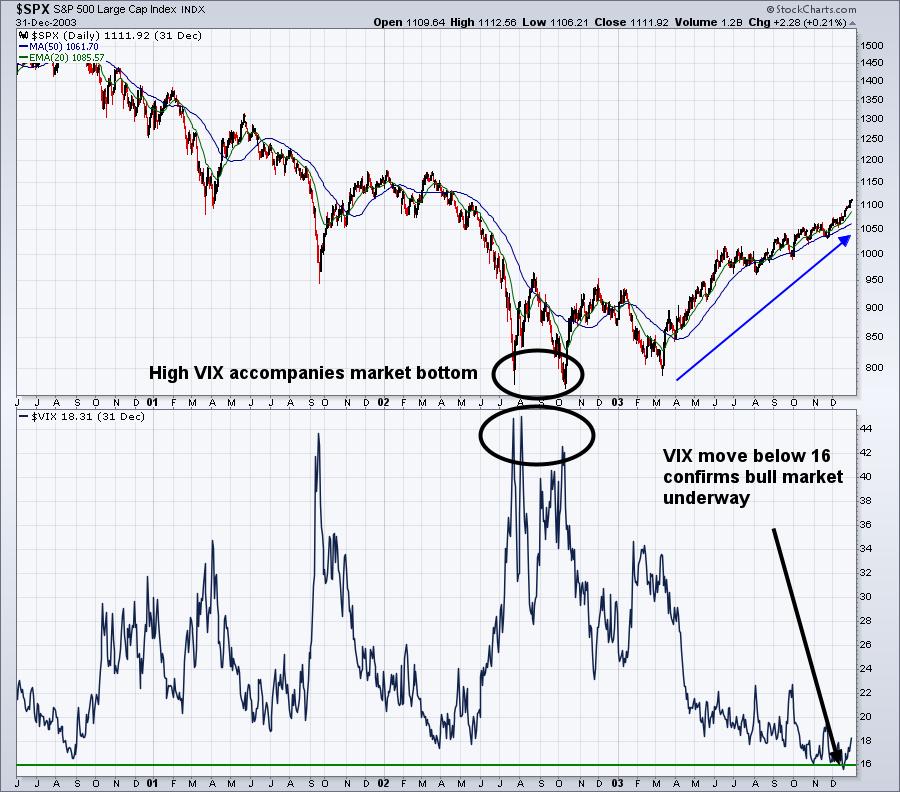
So where are we now? Well, here's what history tells us. When the VIX drops below 16-17, we are OUT of the current bear market and we should expect higher prices. The bottom's already been made and the falling VIX confirms the worst is behind us. Let's look at charts to see what I mean:
2020 Pandemic
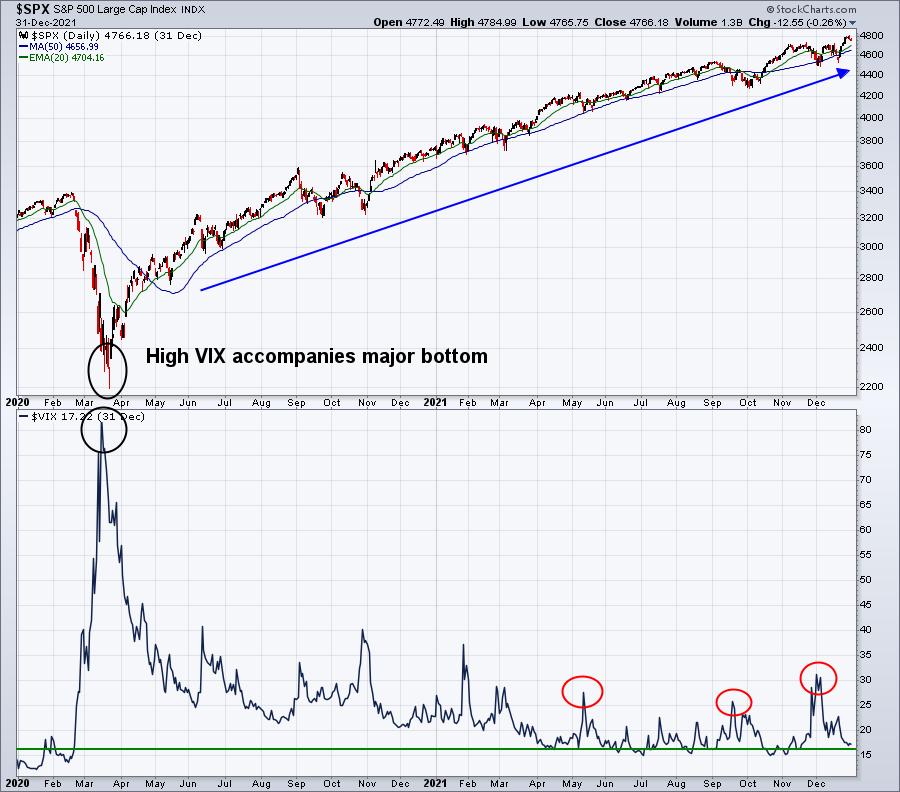
Bear market ended in March 2020. VIX later reached below 16-17 level in June 2021. Confirmation.
2018 Trade War
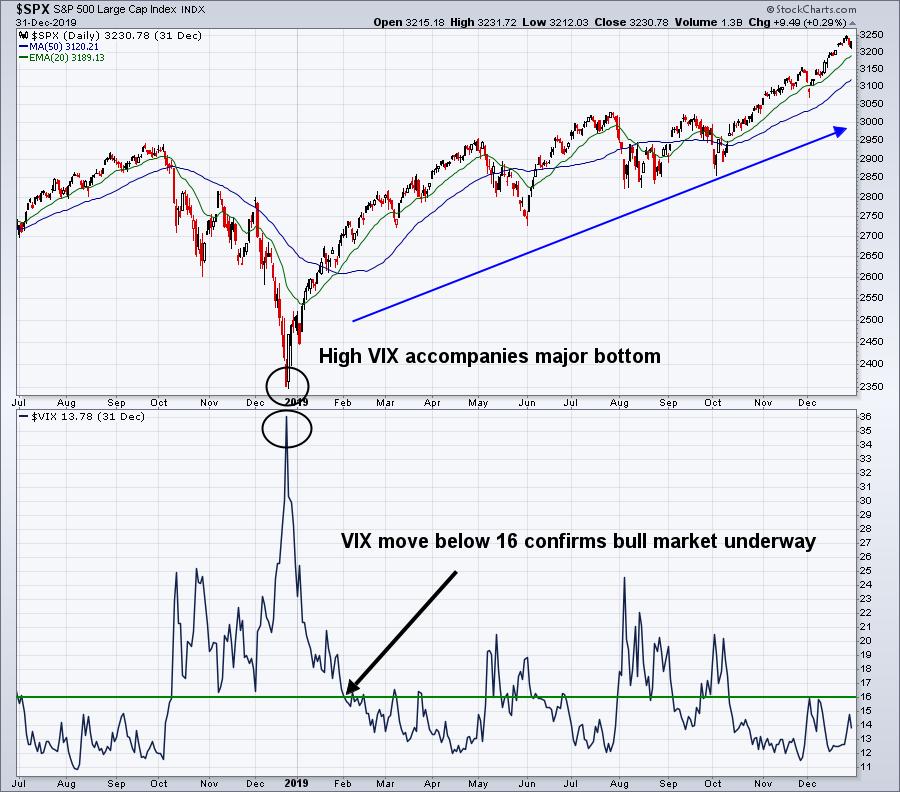
Do you see the rallies in November and December 2019? Note that they occurred after the VIX bottomed in the 16s. The February 2019 drop in the VIX below 16 confirmed a bottom was in.
2007-2009 Financial Crisis
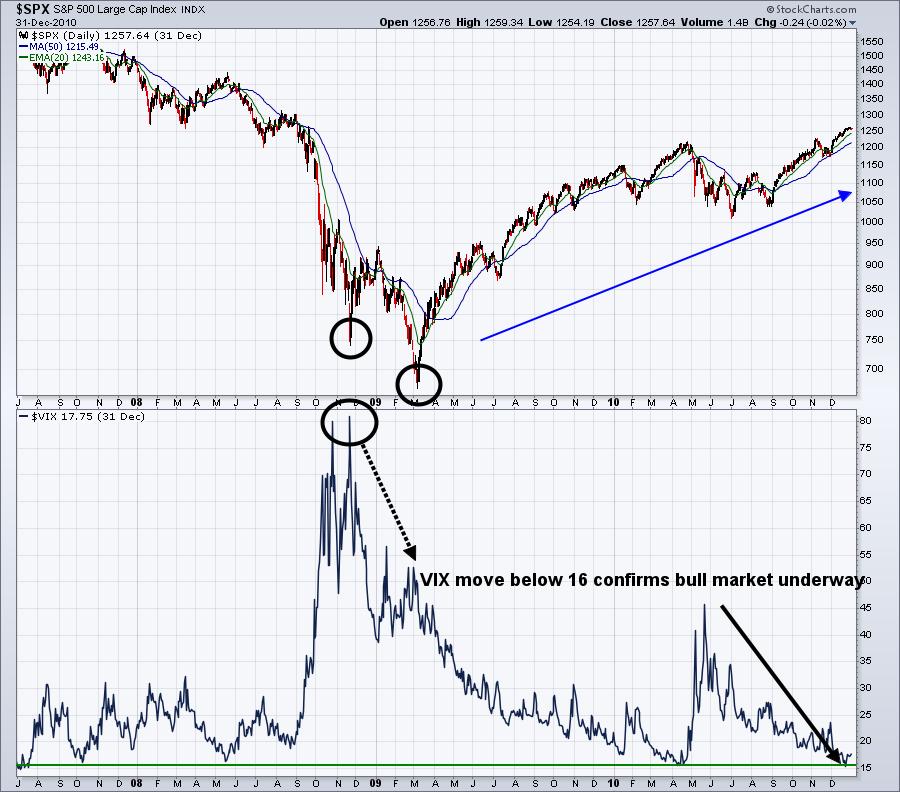
This was not your normal bear market. First, it was the deepest bear market in nearly 8 decades, with the S&P 500 falling nearly 60%. There were "echoes" of fear for quite some time as the VIX remained elevated above 16 for an extended period. But once the VIX fell below 16, the depths of the bear market had already been reached.
2000-2002 Dot Com Bubble
1998 Global Financial Crisis
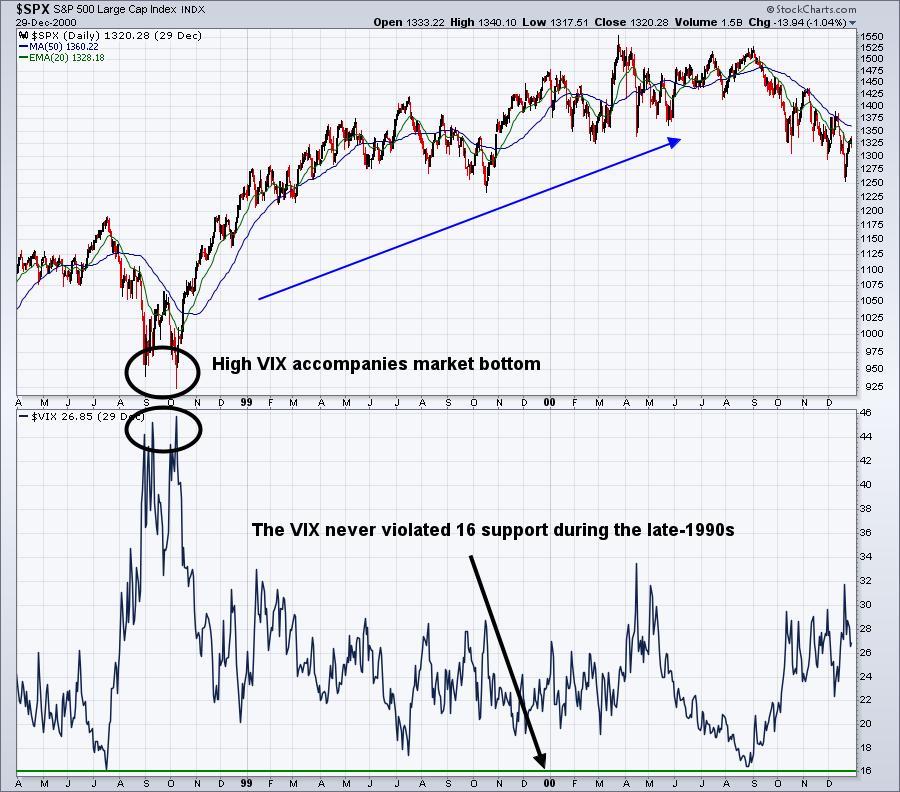
The late-1990s was one of the craziest market runs in stock market history. It's also the only secular bull market period characterized by VIX readings consistently above 16. The best secular bull market in history (1980s-1990s) saw "irrational exuberance" at the end that led to the start of the 2000-2012 secular bear market.
1990 Persian Gulf War
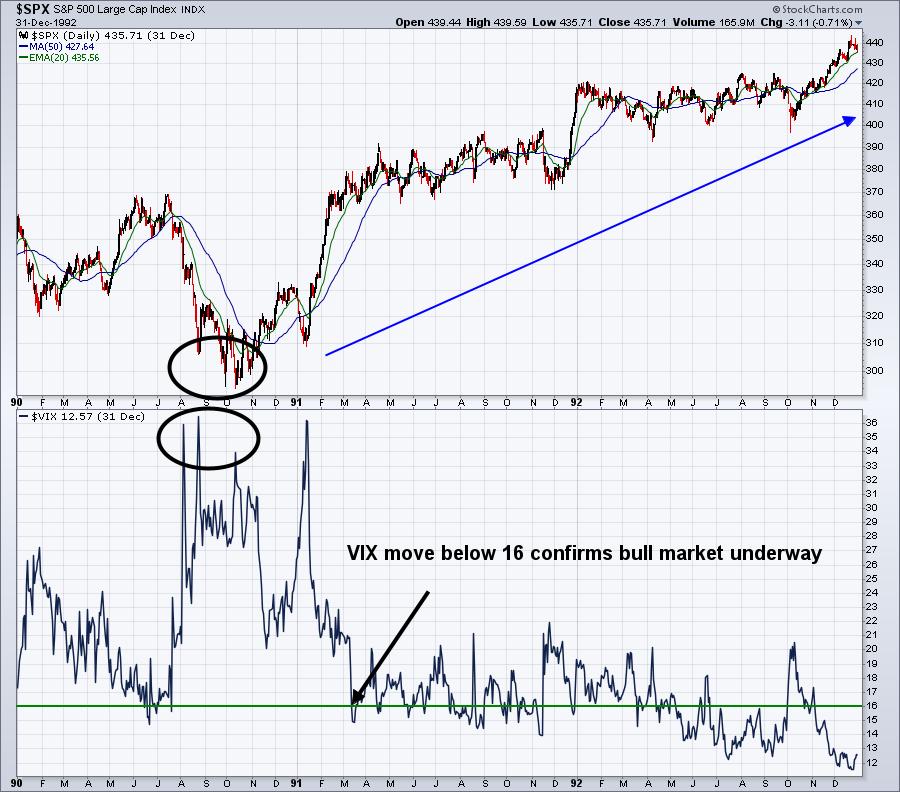
This was a short-lived cyclical bear market that ended almost as quickly as it began.
So where are we now? What should we expect moving forward?
2022 Return of Inflation
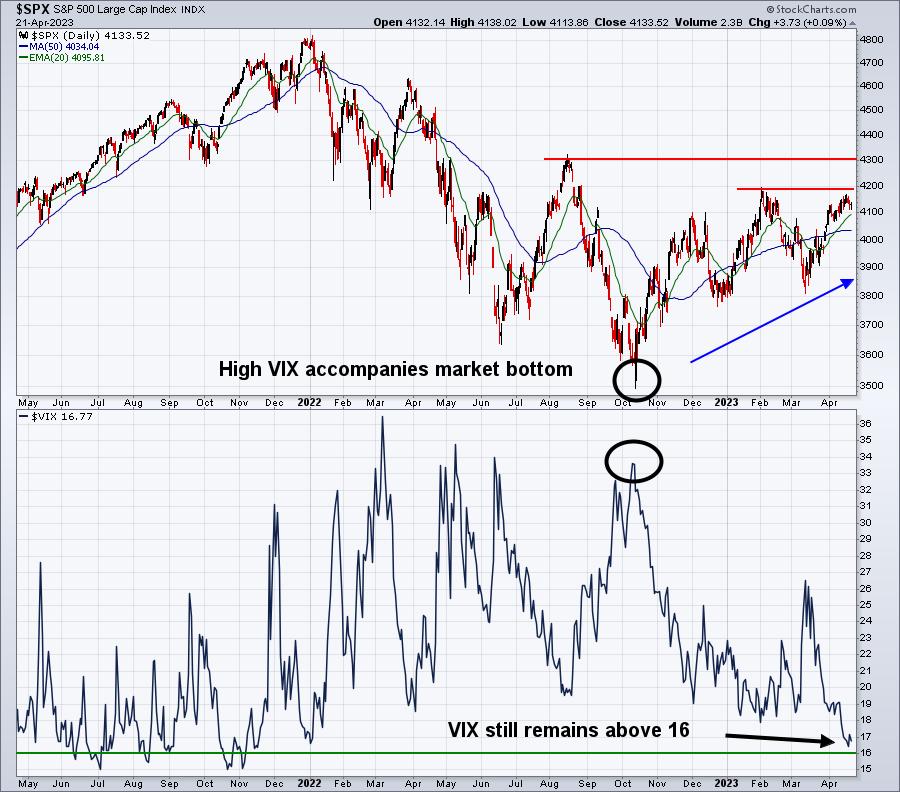
Are we at the start of the secular bull market resumption - the one that began in 2013? Or has this rally set us up for more selling and a lower bottom ahead in a secular bear market?
Two great questions where most market participants have been firmly planted on one side or the other. Personally, I was looking for a cyclical bear market when 2022 began. I looked for a 2022 bottom and then an ensuing rally to all-time highs. So far, so good. Nothing has changed my view. Money has rotated feverishly in 2023 to "risk on" areas of the stock market:
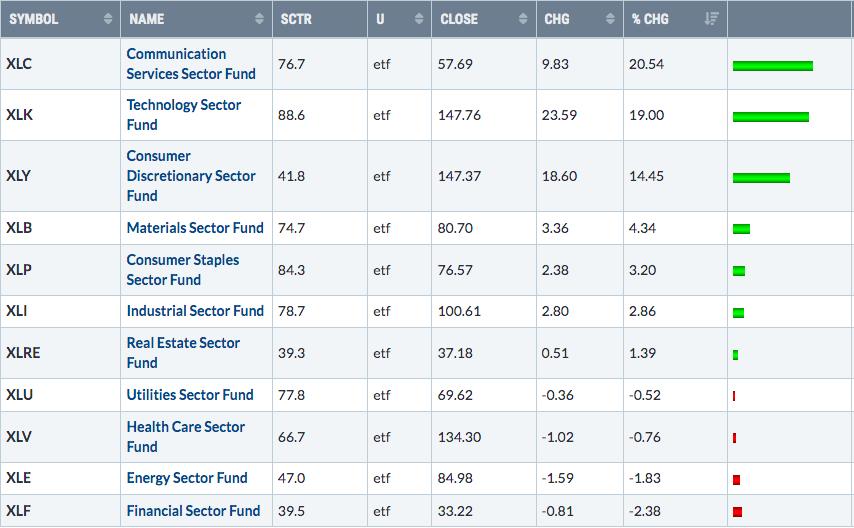
The stock market is rising and being led by aggressive sectors. This is truly a sign of sustainability, in my view, and based on my many years of research.
Oh, and I'd LOVE to argue valuation right now with anyone. In fact, my EB Digest article tomorrow morning will reveal why I believe current market valuations are WAAAAY low and we're poised for a massive rally over the next decade. If you'd like to read this article and are not already an EB Digest subscriber, CLICK HERE to enter your name and email address. It's completely free and you may unsubscribe at any time.
Happy trading!
Tom


