Okay, first when I say "it's easy", I'm not saying it's easy to call tops and bottoms. Instead, I'm say that answering that rhetorical question is easy. If you can call a top, you can exit equities with your capital completely intact. And if you can also time a bottom, you can reinvest at a much lower level. Isn't that a pretty easy and logical reason to seek out market tops and bottoms?
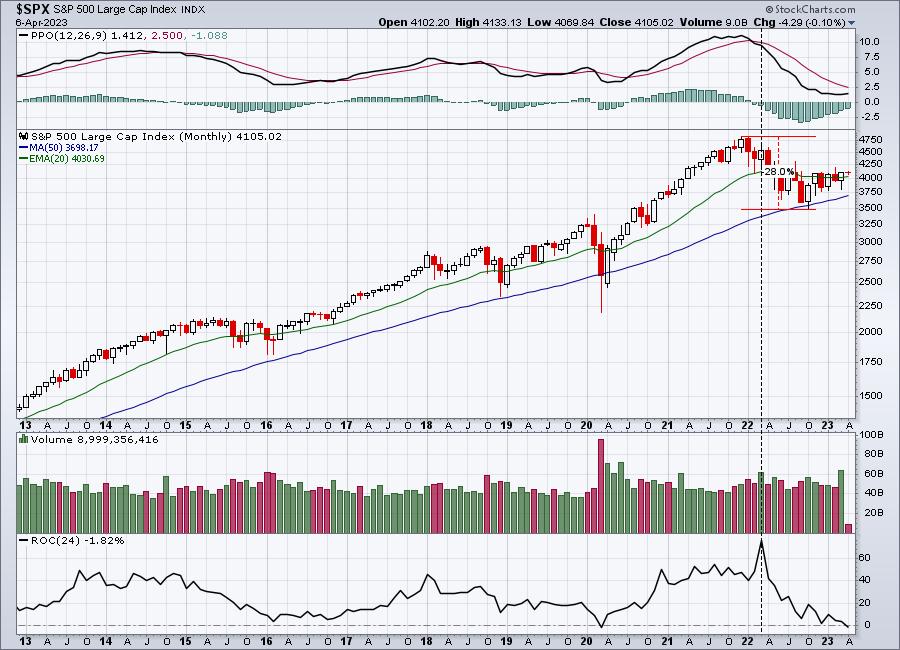
I recall all the negative YouTube reactions in early 2022 when I said the S&P 500 had topped and could drop 20-25% (actually dropped 28%). Many believed the stock market was their personal ATM machine as sentiment turned as bullish as I've ever seen it. Opponents said "you can't call a bear market if we haven't dropped 20%!" I found that response ludicrous. Are we seriously supposed to watch our investments drop 20% and then get out? The majority of cyclical bear market downside is over by the time they're down 20%.
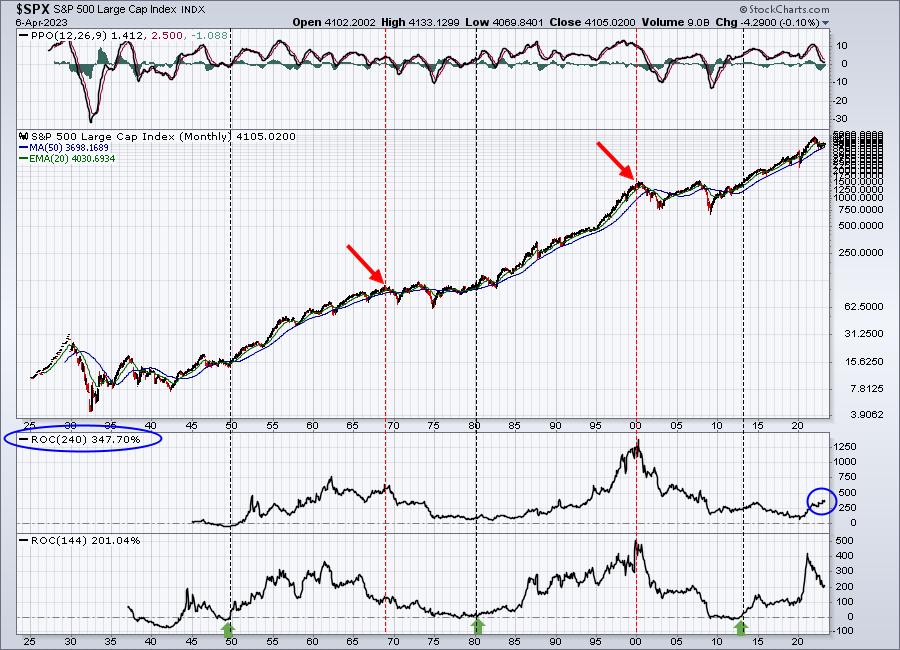
Successful investing in stocks requires a heavy dose of perspective. Stock market history truly does repeat itself over and over. I'll never understand why so many people approach the stock market with so much negativity. It provides the absolute best avenue to grow your money over time. Take one look at this 75-year chart and explain why we should maintain a negative market bias:
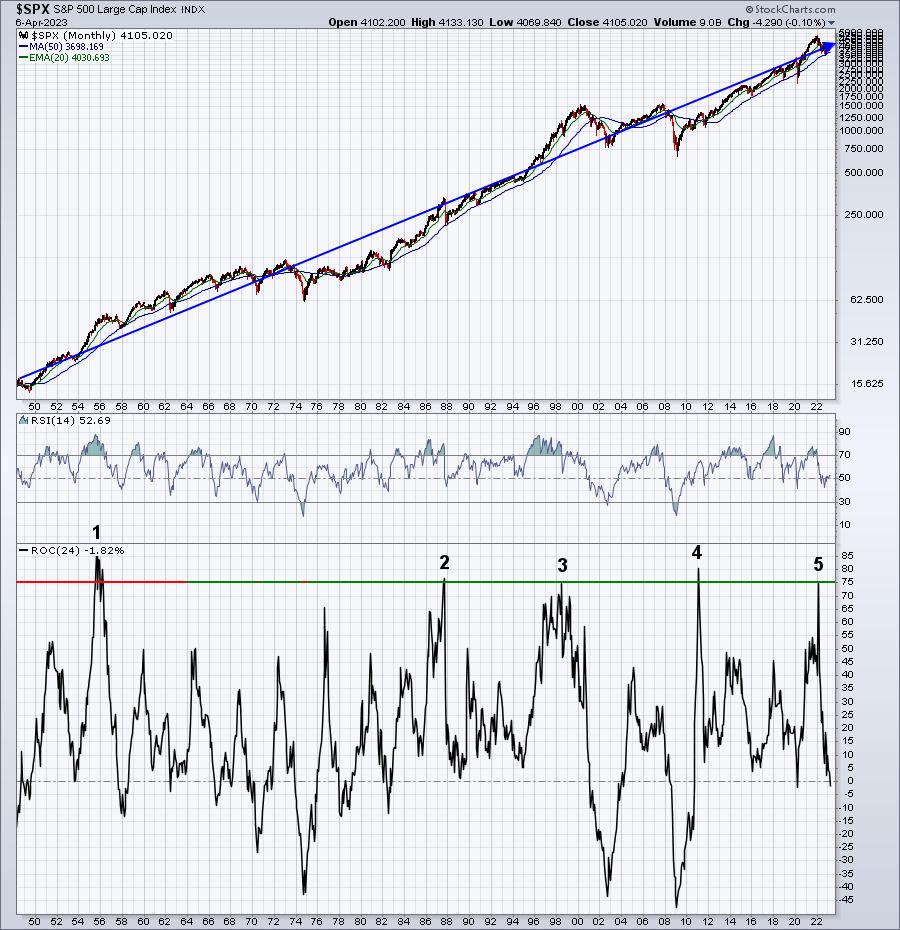
The bottom panel is quite interesting. It's the 24-month rate of change (ROC). Keep in mind that the S&P 500 has averaged gaining just over 9% per year since 1950. So the "normal" 2-year ROC would be roughly 18-19%. The 5 points that I've identified on the chart above highlight the 5 times when this 2-year ROC has hit 75%, which is quite simply unsustainable. There's a reason that we average going higher by 9% or so. Gross domestic product (GDP) plus inflation plus innovation is what produces those 9% gains over time. Moving higher by 75% over 2 years literally suggests to me, "reversion to the mean."
1950s
This was the first example (since 1950) of what happens when you make an unsustainable move to the upside. In this case, the next two years were a total wash - the S&P 500 went nowhere and included a cyclical bear market as prices dropped more than 20%:

Note that once the S&P 500 fell back to test its 50-month SMA, the cyclical bear market was over and the secular bull market of the 1950s/1960s resumed.
1987 Crash
It was more than three decades later before the S&P 500 again saw the type of upside move that begged for a significant correction. That occurred in September/October 1987 as the unsustainable advance of the prior 2 years was simply too much:
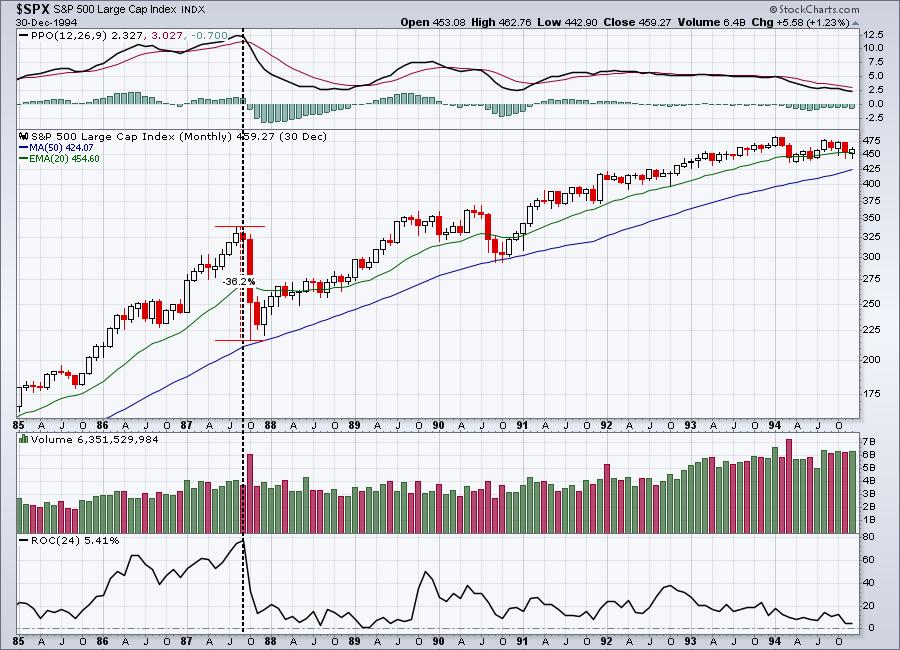
The 1987 cyclical bear market turned out to be one of the fastest 36% drops in history, but it was, in part, foreshadowed by that unsustainable move higher from 1985-1987. Notice that the drop found support at its 50-month SMA, similar to the 1956-1957 decline.

The Late-1990s
There's a reason why it's referred to as the "dot com" era. The gains were as inflated as any time in history, except perhaps the euphoria just before the 1929 market crash and The Great Depression that followed. After the S&P 500 turned in its 75%+ gain over a 2-year period that ended in 1998, we saw a quick cyclical bear market, and then it ran another 55% higher over the NEXT 2 years. It took a secular bear market that included 2 of the worst individual bear markets (2000-2002 and 2007-2009) in history to iron out all the problems that the late-1990s advance created:
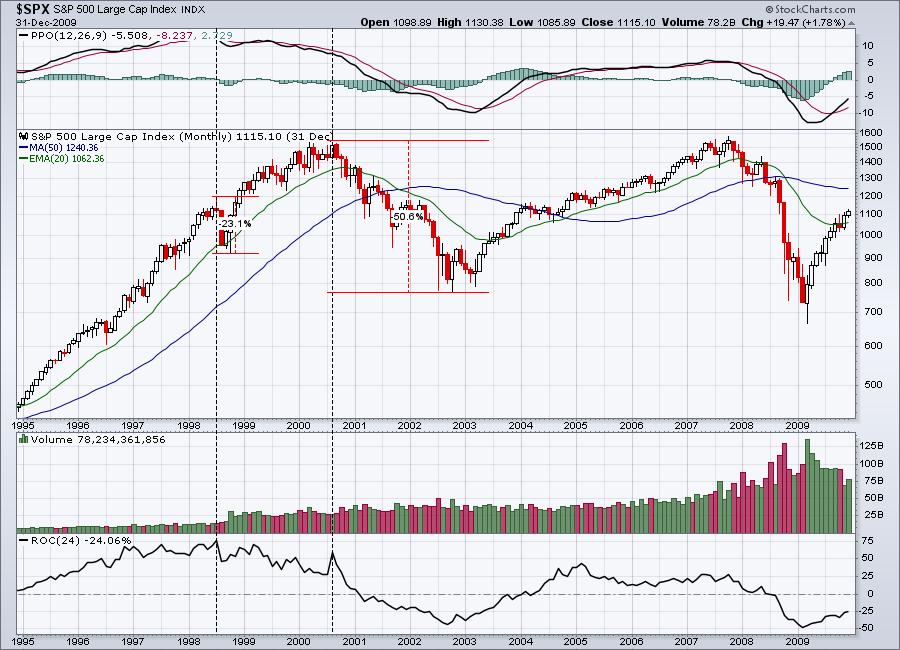
The 1998 cyclical bear market turned out to be a small taste of what investors would be facing in 2000, after the huge advance in 1999, and it never breached the 50-month SMA. It wasn't just a short-term advance that investors had to pay for. It was the end of a two-decade secular bull market, which resulted in an extended period of financial pain, ushering in the next secular bear market.
2011 Rebound
After the depths of the financial crisis were found in 2009, Wall Street rebounded in a big way, generating yet another 75%+ move over the next 2 years:
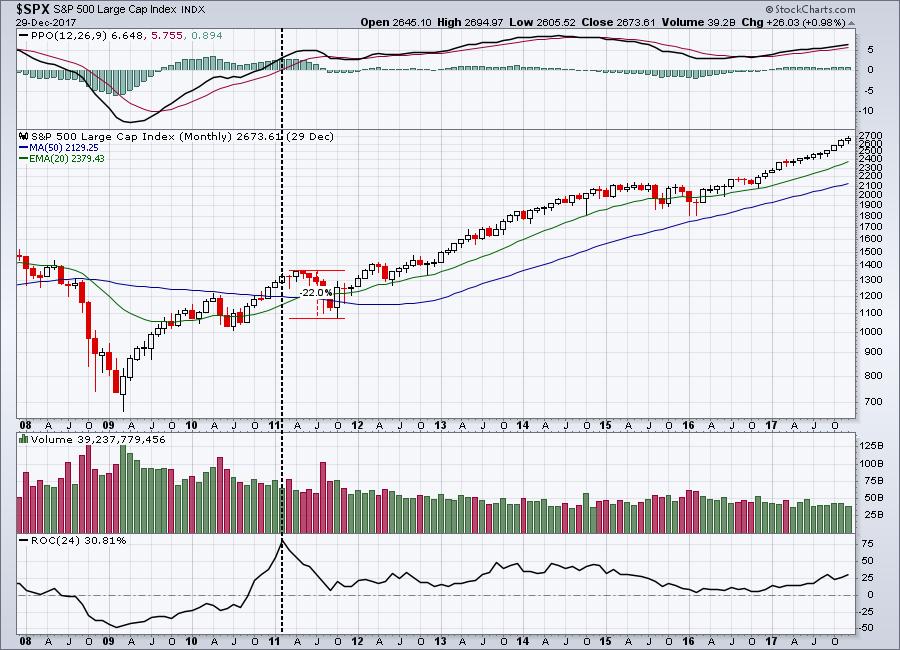
While the new bull market had not yet gotten started - that occurred in 2013 when we finally cleared the tops set back in 2000 and 2007 - the initial rebound was very, very swift, so another short-term drop of 20%+ was warranted and felt. In my view, this did not qualify as a bear market as it never began from an all-time high, but the consequence was the same. Note that the decline did move below the 50-month SMA, but never broke below the 2010 low.
2020 Post-Pandemic Advance
Many were caught completely off-guard by not only the 2020 stock market recovery, but more so by the magnitude of it. The 22-month advance from the March 2020 low through the January 2022 high was only topped by the euphoric 1920s - and there was going to be a price to pay. As I discussed at our MarketVision 2022 event, there were plenty of other warning signs, but the sheer magnitude of this advance suggested that caution be advised in anticipation of a potential cyclical bear market:
Once again, we've seen the 50-month SMA provide excellent support and confirm - at least for now - that the 2022 bear market was, in fact, cyclical in nature. Should we see the S&P 500 move below the October 2022 low, then a re-evaluation would be in order.
Final Thoughts
Secular bull markets have historically lasted two decades, while secular bear markets typically unfold over a dozen or so years. So I thought it would be interesting to review a long-term chart of the S&P 500 with a 20-year ROC and a 12-year ROC beneath the price chart. Here it is:
The green arrows in the 12-year ROC panel at the bottom show that the cumulative 12-year return is at roughly zero when new secular bull markets emerge. Meanwhile, those red directional lines highlight that secular bull markets end after a lengthy period of above-average market returns. Right now, our 20-year ROC is at 347%. That's an average annual return of 7.78%, compounded over 20 years. The AVERAGE S&P 500 return has been over 9% since 1950. Therefore, it's difficult for me to buy into the argument that the secular bull market has run its course. I believe we have much further to go. The 20-year ROC reached 750% in 1962 and was at 625% in 1969, when the 20-year secular bull market ended. The 1950s and 1960s had a compounded annual average return of 10.5%. The 1980s and 1990s had a compounded annual average return of 14.5%.
And I'm supposed to believe that this secular bull market has topped out at 7.78%? I don't think so.
Now is the time to STOP listening to media outlets like CNBC. They offer little substance and value. Instead, turn your attention to EarningsBeats.com. We kept our members out of harm's way throughout the cyclical bear market of 2022 and we said it was time to get back in the S&P 500 when it was 13% lower. Our next MAJOR event is this Saturday, April 15th at 10:00am ET. It's our "Bulls-Eye Forecast" event, where I'll provide you my latest expert opinion as to what you should expect over the balance of 2023 and into 2024. Best of all, it's a 100% FREE event. Registration is required and you may do so by CLICKING HERE.
I look forward to seeing you on Saturday!
Happy trading,
Tom


