Price Action
Clearly, the most important aspect of the stock market is price action. That's where it all begins. Currently, I like the daily and weekly charts, but we do still have one very important price resistance level to clear:
S&P 500 - Weekly:
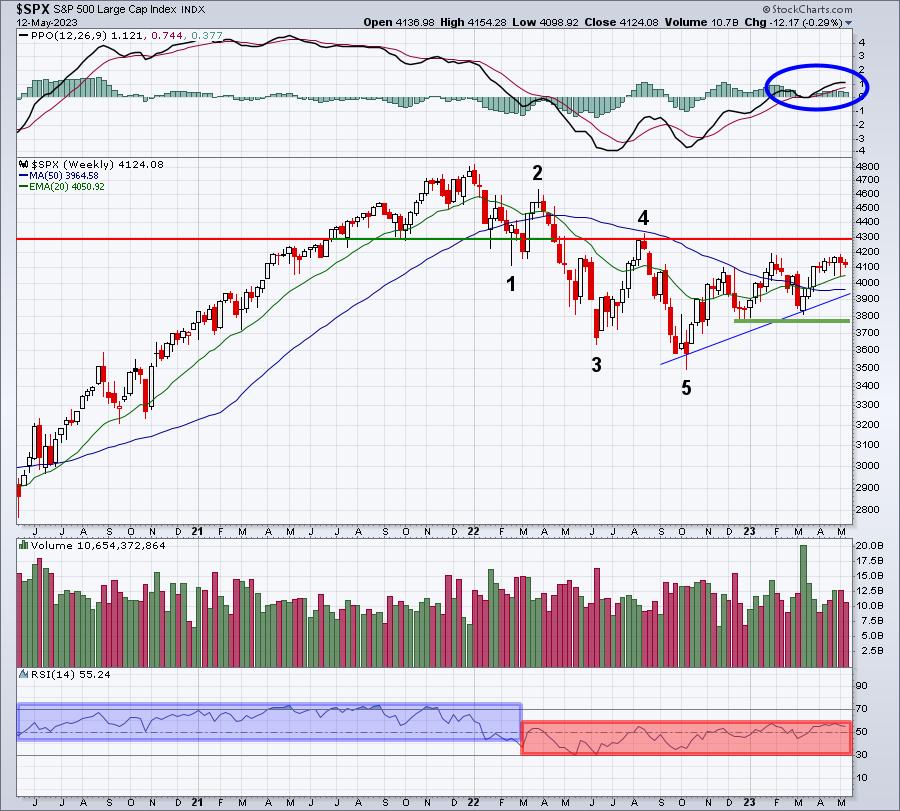
There are obvious improvements on this chart in 2023. First, the downtrend was broken in January and, after retesting the breakdown line, we've seen prices move to higher highs. Next, the PPO broke above centerline resistance. It quickly returned to centerline support, but instead of rolling right back over with more bearish momentum, PPO moved back to a higher high - just like price action. That tells us, at least for now, that bulls remain completely in charge. Could that change? Of course and that's exactly what the bears are hoping for. Personally, I need to see it first.
I see the market as range bound. I believe 3775 is very solid intermediate-term price support, while 4300 is the next wall of price resistance. Which one breaks first? That'll be a significant clue as to what we should expect over the balance of 2023 and into 2024. We should note that while price action has been solid in 2023, we have no RSI confirmation of a secular bull market advance just yet. During downtrends, the RSI typically resides in the 30-60 range, with occasional dips below 30. The weekly RSI is at 55 and has yet to move above 60. So while I remain bullish over the balance of 2023, it's not a slam dunk and we need to remain objective.
S&P 500 - Daily:
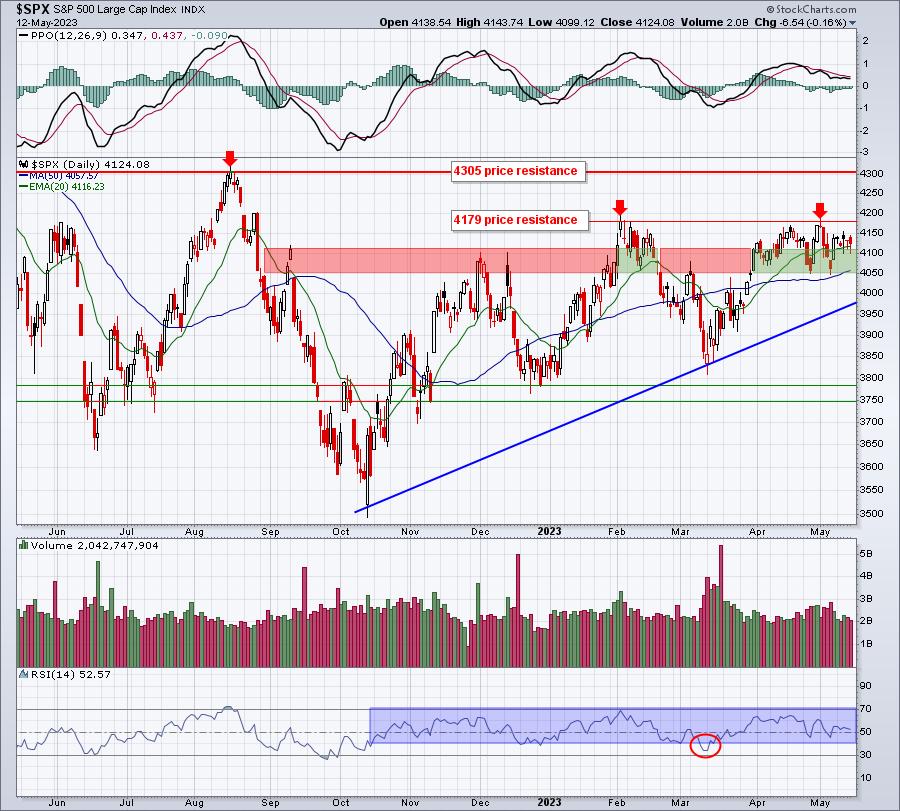
This chart tells me a story. One historical fact is that 6 of the last 13 bear markets have ended during the month of October. If October 2022 ultimately proves to be the low, it'll mark the 7th out of the last 14. That's a powerful number that certainly provides us evidence of a potential market bottom. The uptrend off that potential October bottom is obvious. There's been a bit of hesitation and consolidation along the way, but there are a series of higher highs and higher low, which is the definition of an uptrend. It cannot be ignored, even if you're in the bearish camp. There is also a clearly-defined short-term closing price resistance of 4179. We've been there twice now without a successful breakout. A close above 4179 should be viewed bullishly.
Over the past 8 months, the 4050-4100 area has shown to have fairly serious price support/resistance. I've highlighted key moves into and out of this zone in red (price resistance) and green (price support). There's also the 50-day SMA, currently at 4057, to provide some support for the bulls. In the very near-term, the bulls and bears are battling in this 4050-4179 area. On short-term breakouts vs. breakdowns, I'd say the bears have one advantage. If price resistance at 4179 is broken, it's a fairly short trip to MAJOR 4305 price resistance. That's the August 2022 high that I believe completely changes the picture on the weekly chart, confirming the resumption of the secular bull market by ending the series of lower highs and lower lows (refer to the numbering of 1 to 5 on the weekly chart). But what happens if price support at 4050 is lost? There's nearly 300 points of downside to consider to the 3775 support level.
Price action is our PRIMARY indicator. The reason I do all the research I do and study history like I do is quite simple. I don't want to wait for the S&P 500 to move from a 3491 low to a breakout above 4305 before admitting the stock market is in an uptrend. That's over 800 points and approximately 23%. That's the equivalent of 2 1/2 years of normal S&P 500 returns (the S&P 500 has averaged gaining 9% or so per year since 1950). The stock market does provide us clues as to its "under the surface" strength and weakness. We can evaluate the risk of being long vs. being short or in cash from these signals. But you have to know what to look for.
Leadership
History tells us that it's very important to see leadership from "risk on" areas of the stock market during bull market advances. That includes our most aggressive sectors - technology (XLK), consumer discretionary (XLY), and communication services (XLC). The S&P 500 finally cleared its 2000 and 2007 highs on April 10, 2013. That was the date, in my opinion, that the current secular bull market began. From that day through the January 3, 2022 market top, the S&P 500 and the 11 sectors performed as follows:
- S&P 500: +202.10%
Sectors:
- Technology (XLK): +554.95%
- Consumer discretionary (XLY): +338.25%
- Communication services (XLC): +303.71%
- Health care (XLV): +239.38%
- Financials (XLF): +210.98%
- Industrials (XLI): +196.65%
- Materials (XLB): +173.02%
- Real estate (XLRE): +171.40%
- Consumer staples (XLP): +140.95%
- Utilities (XLU): +138.39%
- Energy (XLE): +0.63%
The 3 key "risk on" sectors - XLK, XLY, XLC - dominated the action throughout the entire secular bull market. During a period of strong economic growth and historically-low interest rates, that leadership completely makes sense to me. We all know we've been through a very challenging market since the 2020 pandemic. Many believe we have steep challenges ahead that will drive equity prices lower. Maybe they will, but I'm not in that camp. We remain in an extremely low interest rate environment and the stock market looks ahead 6-9 months. The fact that we've seen the 10-year treasury yield ($TNX) falling for 7 months, dropping nearly 100 basis points, tells me that bond market traders are ignoring inflationary risks and are instead concentrating on the likelihood that the Fed will hike rates no more - and possibly even lower them. That, in turn, is resulting in a substantial shift once again into the aggressive sectors garnering more than their fair share of rotation. Check out this year-to-date performance summary of the 11 sectors:
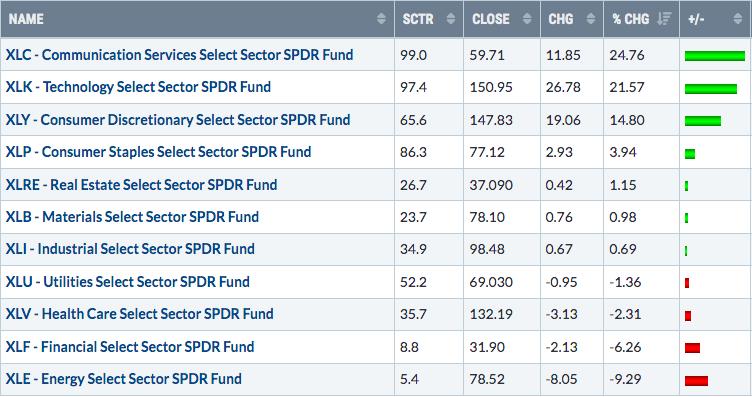
Notice which sectors are leading, by a mile? This is normal secular bull market behavior. The S&P 500 is up 7.41% year-to-date, led by aggressive growth stocks. It sure seems like the key sectors are leading the benchmark higher in 2023, just as they've done throughout the entire secular bull market. This is a critical "under the surface" indicator that does not support the bears' argument of lower prices ahead.
Sentiment
When I spoke at our MarketVision 2022 event on Saturday, January 8th of that year, I said the number 1 issue facing the stock market was NOT inflation. It wasn't interest rates. It wasn't a potential recession. It wasn't the Fed. Instead, I argued the biggest issue was SENTIMENT. Retail traders had grown incredibly bullish and that spelled BIG TROUBLE as we opened 2022. I suggested, in a worst-case scenario, that the S&P 500 could visit the 3500-3800 range. That's when the S&P 500 was near its all-time close to 4900. That was a very bold prediction. But it came true 9 months later when the S&P 500 hit a final low of 3491.58 on October 13th. I warned the bulls and continued to do so for the next several months until saying the risk of being short (or in cash) had escalated and I reversed course. History has proven me correct. And now sentiment is about to provide a MAJOR signal that every trader needs to be aware of. When this signal has been provided in the past, it's preceded an unbelievable market reaction every time.
I'll provide that signal in advance in Monday's FREE EB Digest article. The signal almost certainly will trigger later this month and, if it's correct again, it will provide you a very meaningful directional signal regarding the benchmark S&P 500. If you'd like to discover one of the most important "beneath the surface" stock market signals, CLICK HERE and provide your name and email address to subscribe to our EB Digest newsletter. Again, it's free, there's not credit card required, and you may unsubscribe at any time!
Happy trading!
Tom
PS. If you haven't subscribed to this Trading Places blog, be sure to do so by scrolling down and providing your email address. Once subscribed, every Trading Places article will be sent to your inbox the moment it's published!


