It was one month ago that I discussed the serious (short-term) warning signs that the stock market faced. I summed it up pretty well on a Your Daily Five recording that aired on July 19th. Calling weakness after it hits is easy, but discussing objectively the warning signs BEFORE the market drops is where our value at EarningsBeats.com begins. If you didn't get a chance to see this Your Daily Five video, here it is:
Tom "The Bull" Bowley is Bearish? What?!?!
In it, I discussed two sentiment indicators:
- Volatility Index ($VIX), highlighting the positive correlation with the S&P 500, suggesting a market downturn approaching.
- Equity-only put call ratio ($CPCE), pointing out that the 5-day moving average had dropped to a 15-month low. Extremely low readings on this moving average have historically coincided with market tops.
I also discussed the bearish historical time of the calendar month (the 19th to the 25th has proven to be EASILY the worst time of ALL calendar months), with negative divergences everywhere on daily charts. I even suggested that Tesla (TSLA), which was trading at 293 at the time, could fall to 230. It's actually at 216 this morning (last time I checked). These are "before the market drops" calls.
So where do we stand now? Well, Volatility ($VIX) has pretty significant resistance at 20, and that's where I thought the VIX could run -- in a worst-case scenario. Here's the VIX chart:
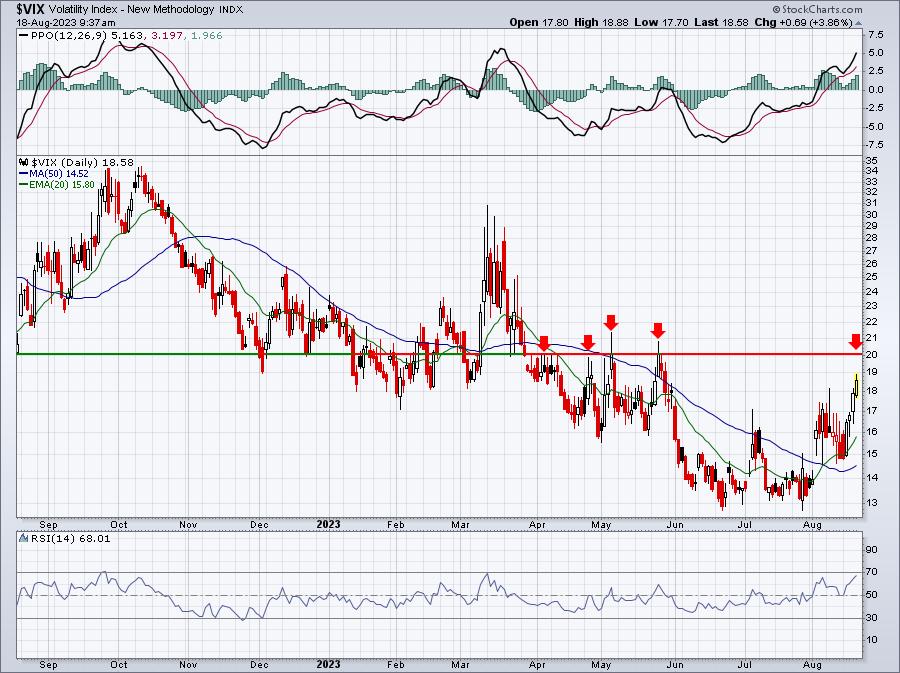
We're getting close to where the VIX has failed over the past 4-5 months. Could it rally past this level? Sure, anything is possible. But if I'm right about this secular bull market, then I doubt we see a close above 20. We'll see.
How about that 5-day moving average of the put call ratio ($CPCE)? Well, we've gone from extreme complacency in mid-July to extreme pessimism currently. This moving average has reached .85 as of yesterday's close. I believe this is THE most telling indication of how stretched we are right now to the downside. Check out this turnabout:
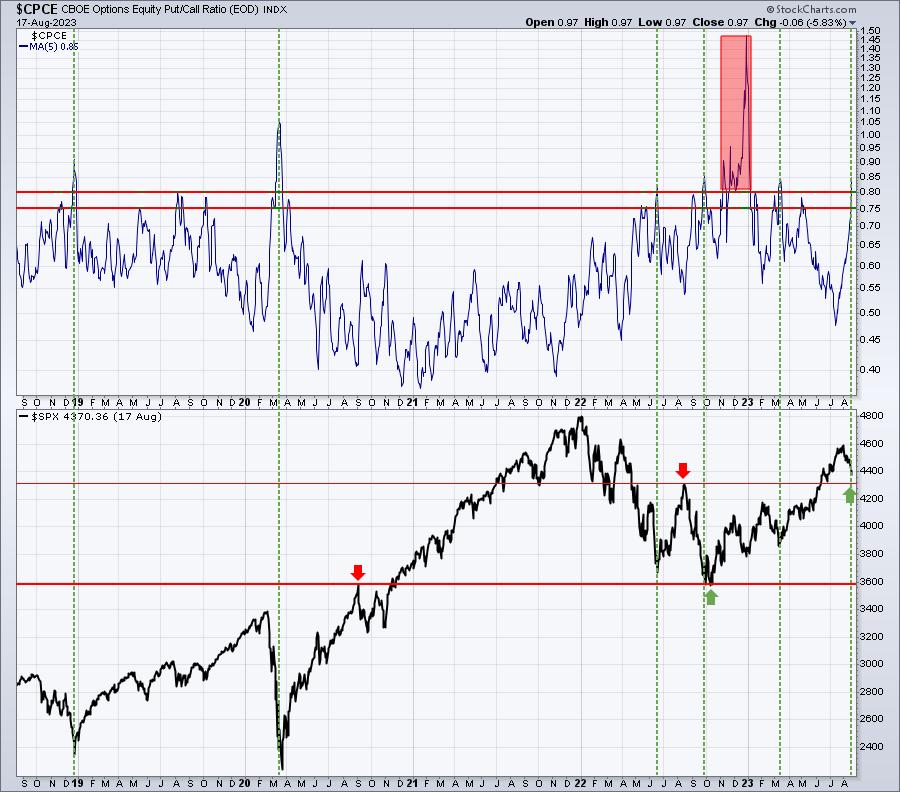
A little over a month ago, this 5-day moving average was below .50, its lowest reading since April 2022 during the height of the cyclical bear market. And in just a few weeks, bearishness has sent our 5-day moving average of the CPCE to .85, its HIGHEST level since March. If you recall, that level of extreme pessimism helped to launch the massive rally we experienced over the summer. Don't fear what others fear. Take advantage of it.
One final note on the CPCE. Here's the table of cumulative half-hour readings of the CPCE over at CBOE.com. To move the cumulative reading like it moved in the final 3 readings is EXTRAORDINARY. Retail traders were buying puts hand over fist in the final hour or so of trading on Thursday. The masses rarely get it right. Check out this table:
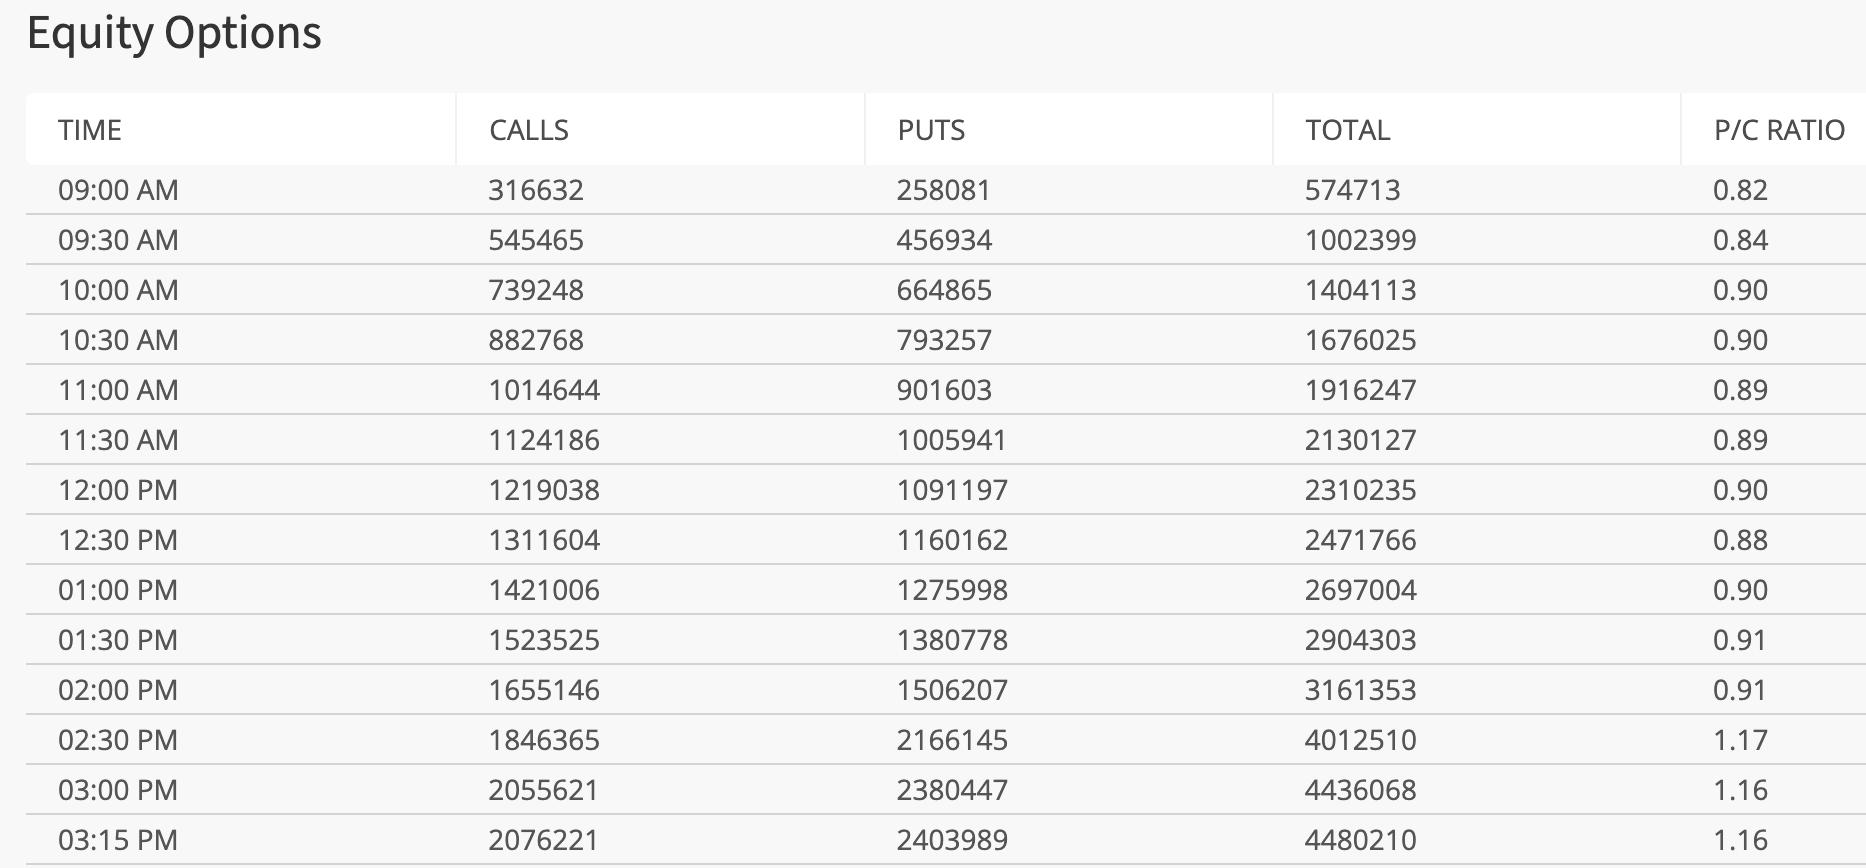
This is CENTRAL TIME, one hour behind those of us on the east coast. So the 2pm reading CT is 3pm ET. So in that half hour from 3:00pm-3:30pm ET yesterday, the individual half-hour readings came in at 3.45!!!! That smells like capitulation to me! I'll be watching these half-hour readings throughout the day today.
Next, it's always important to watch negative divergences. These warnings should never be taken lightly, as they typically precede more significant selloffs during secular bull market advances. Here is how the S&P 500 ($SPX) and NASDAQ 100 ($NDX) looked on July 19th, the day I recorded my last Your Daily Five:
S&P 500:
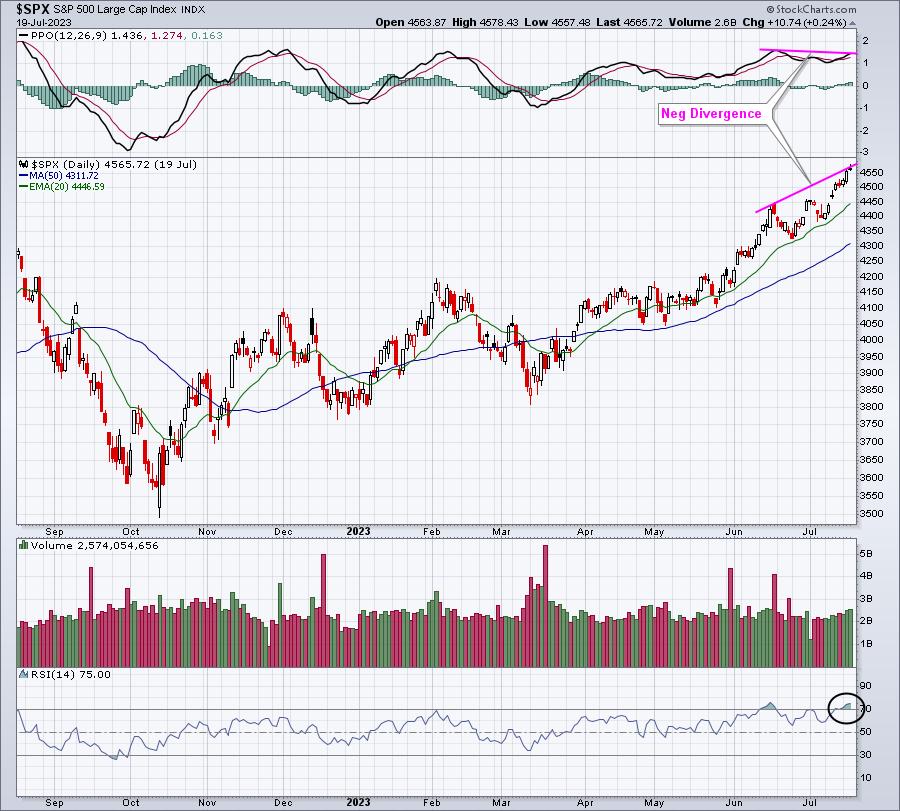
The RSI was at 75, indicative of very overbought conditions, and the negative divergence suggested slowing momentum. This combination, along with the sentiment issues, didn't guarantee us that prices would drop, but they certainly SCREAMED at us that the risk of a drop had increased significantly. Now we know the result.
NASDAQ 100:
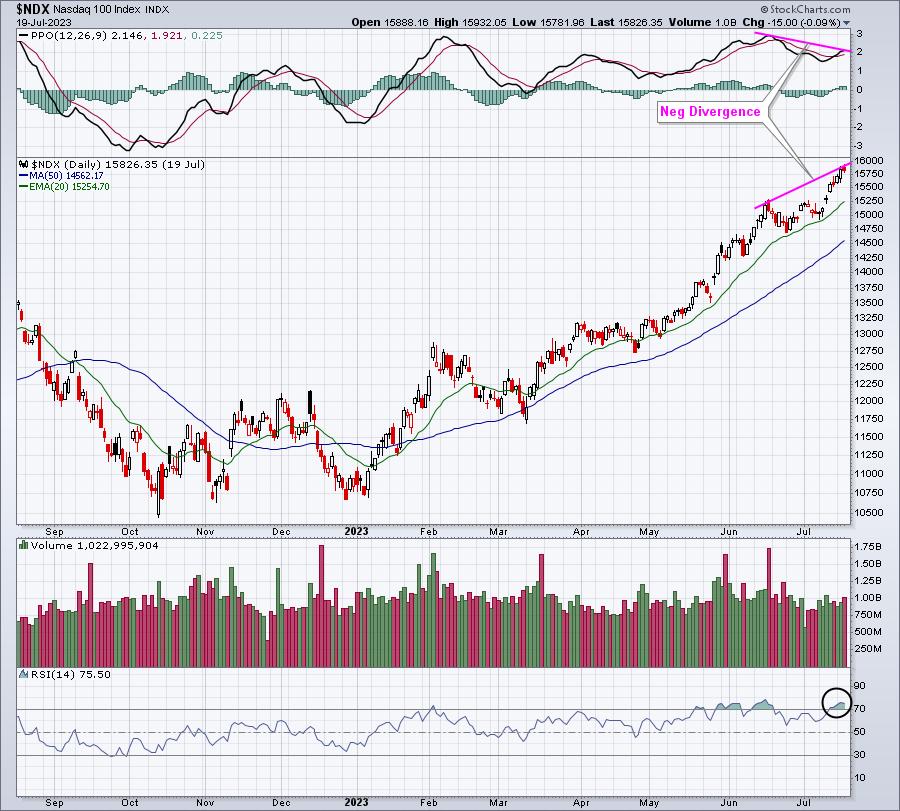
This negative divergence was even more pronounced. Again, we now know the result of these warning signs.
It's important to note that we're also in the worst calendar period of the year. Unlike those spewing "Go Away in May", I've actually done the research to correctly point out that the worst period of the year is from July 17th (close) to September 26th (close). All of this current weakness has been during this weak summer period -- once again.
So do the technical indications support a potential reversal back to the upside? I say yes. When I pointed out the potential for selling a month ago, I indicated that my "worst-case scenario" for a continuing secular bull market advance would be retesting the August breakout on the S&P 500 at 4305, while simultaneously testing the rising 20-week EMA. Here's a current view of the longer-term weekly chart, highlighting the last 3 years:
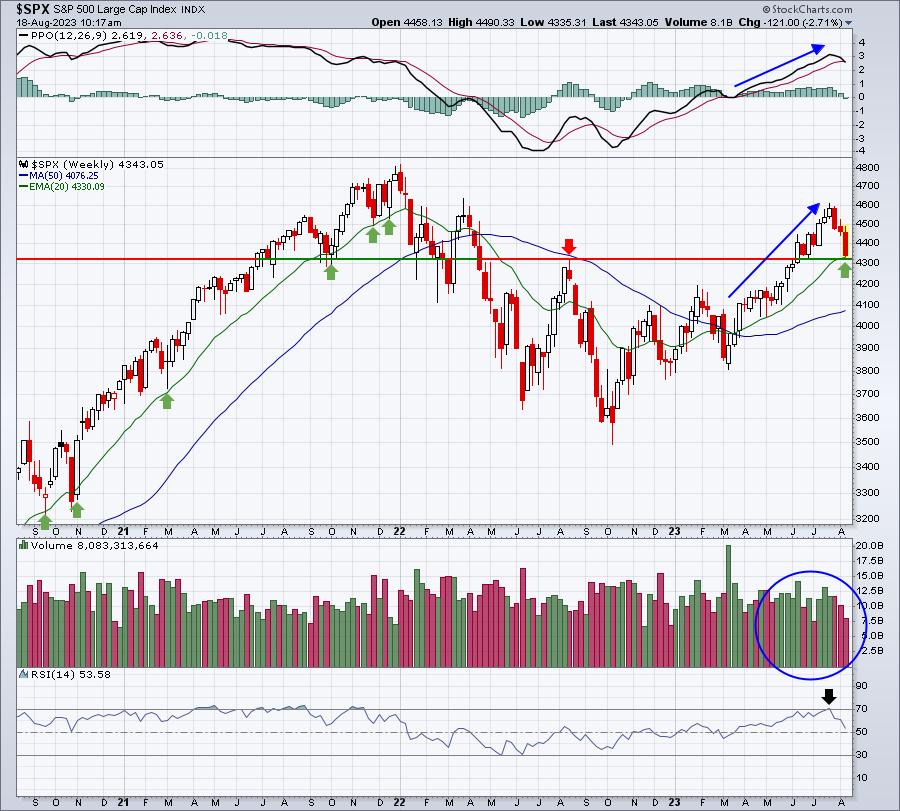
If I didn't listen to any news stories and this chart was the only thing I had to look at, I'd say the following:
- Volume trends are strong (rises have been on heavy volume, currently selloff on lighter volume)
- Weekly PPO has been accelerating to the upside throughout 2023, right up until the July high
- Weekly RSI became overbought at the July high, suggesting a possible pullback to relieve overbought conditions
- We've pulled back to test the rising 20-week EMA, which has a history of support market advances
But here's the problem: nothing is rational when big selloffs approach bottoms. Volatility sends stocks gaining and losing much higher percentages on a daily basis, and the whipsaw action can be very alarming. Plus, if you're off by 1-3 days on a bottom, it can mean another 5% or more to the downside, which makes you question your signals.
If I'm being totally objective, again ignoring the short-term volatility and emotional toll, mid-July's story was one of caution and suggested minimizing risk. The current environment, however, is the mostly opposite of what we saw one month ago. This is the time to hold your nose and buy.
Just my opinion.
Happy trading!
Tom


