I've been watching the Volatility Index ($VIX) for years and it provides us a number of very important signals. One of those signals is BE CAREFUL when the VIX moves from the teens and into the 20s. In my experience, moving from 13 to 15 isn't the same as moving from 19 to 21. We saw the latter last week and, if history is any guide, we need to be very cautious as we approaching this week.
History of VIX Moving Above 20
We've had plenty of bouts with fear rising, even during the past 10-11 years of secular bull market action. Yes, I believe we remain solidly in a secular bull market. I've said it repeatedly, because that's what I believe and what I see in my longer-term signals. You may not agree with me, and that's fine, but I do have conviction. Without conviction of the Big Picture, the market's ups and downs will make investing/trading emotionally exhausting. "We're in a bull market! No, now we're in a bear market!" One day, the sky is falling. The next day, we have glorious sunshine. How do you cope with it? Well, it's having a solid grasp of how the stock market works. Fear comes and goes and it's measured in multiple ways. Today, let's focus on the VIX.
The escalation of fear is what drives very rapid acceleration in selling. If you study history, you'll see that every significant selloff this century has coincided with a VIX reading that soars above 20. But not every move above 20 results in a major selloff. Not only do we need to be aware when the VIX moves through 20, but we also need to realize that we're at a very important juncture short-term. In my opinion, the current secular bull market began on April 10, 2013, when the S&P 500 cleared previous price tops in 2000 and 2007. Here's the chart that validates what I believe was the start of the current secular bull market:
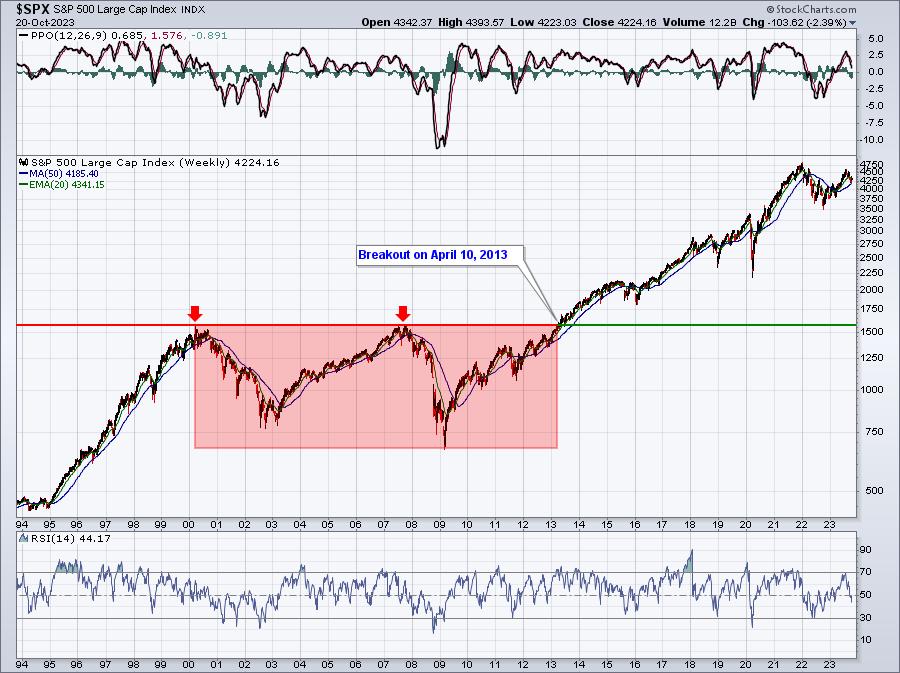
The red-shaded area represents the last secular bear market, where we literally had no new highs on the S&P 500 for 13 years. I believe it's rather obvious to see that we're now in an uptrend, despite several major bumps in the road. Since that 2013 breakout, I count 36 times that the VIX has broken from the teens to above 20, signaling rising fear that we need to be aware of. Of the prior 35 occurrences, 23 resulted in almost immediate bottoms. That is, in roughly 2 out of 3 occurrences, the VIX trip above 20 marked a significant bottom. Let me provide you several 2019 examples in the following chart:
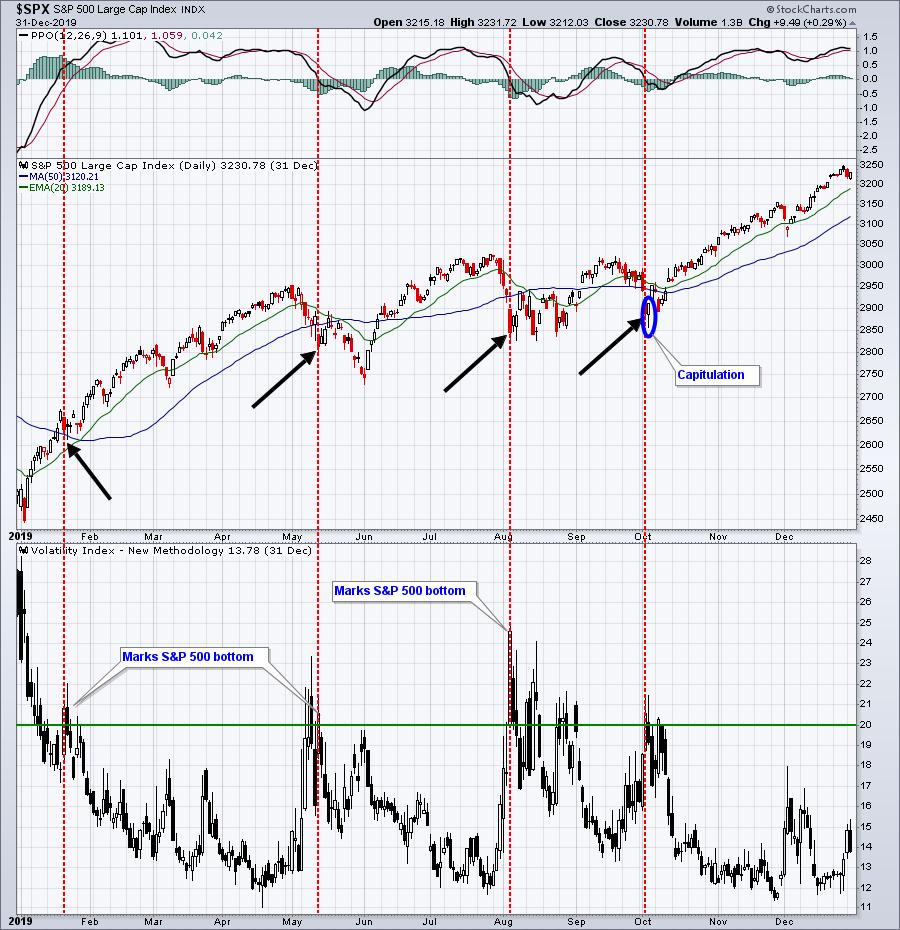
The VIX trips above 20 didn't last and, essentially, that initial close above 20 marked the S&P 500 bottom. But, in approximately one-third of these jumps through 20, the VIX signals us something more serious in the near-term. Here's an S&P 500 chart since the trade war days of Q4 2018, highlighting the more serious VIX warnings above 20:
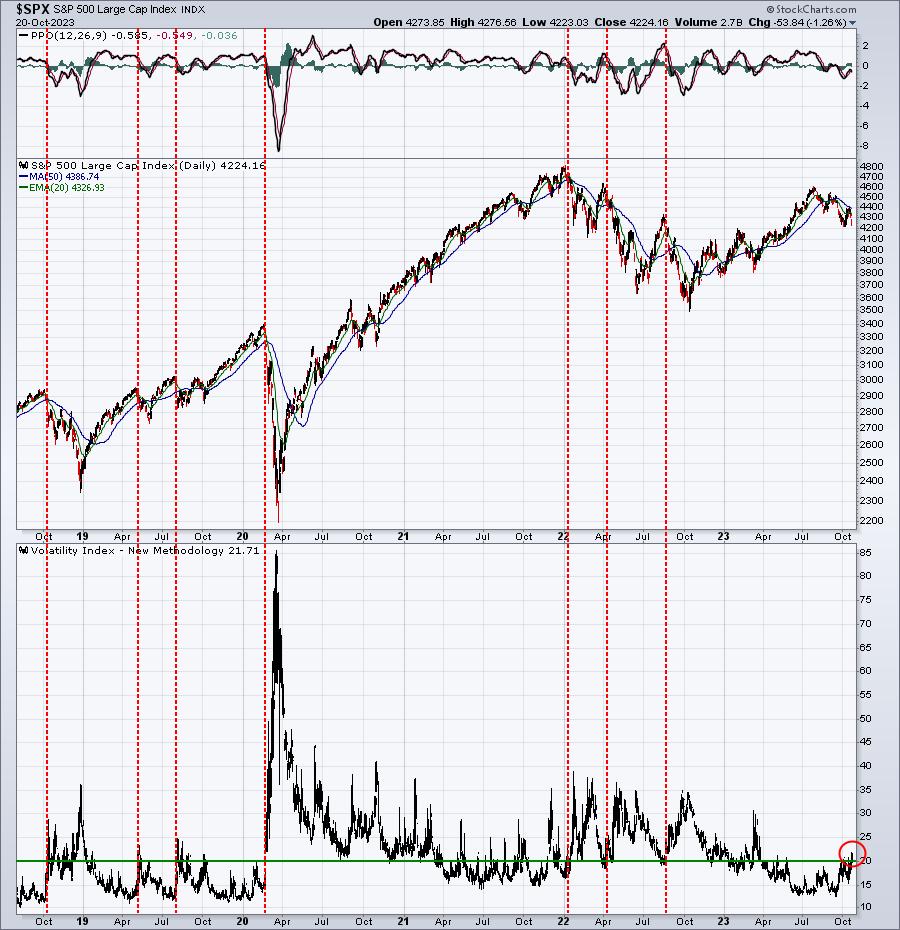
These examples were much more serious and selling escalated rapidly. Avoiding that short-term carnage would make a huge difference in a trader's account. By the way, keep in mind that the current secular bull market has withstood all 35 prior occurrences. On Thursday and Friday of last week, the VIX jumped to close back above 20. But is this latest spike in fear going to result like 23 of the prior such jumps and mark the bottom now? Or will the fear continue to escalate and send prices lower rapidly? Well, there are no guarantees, but I believe it's prudent to believe that the odds of prices tanking this week, at least for a couple days, is stronger than 33%.
I have two reasons that support this notion of lower prices in the week ahead.
Bearish Technical Price Action
We only need to look at the S&P 500 daily chart to see the technical issues present at Friday's close:
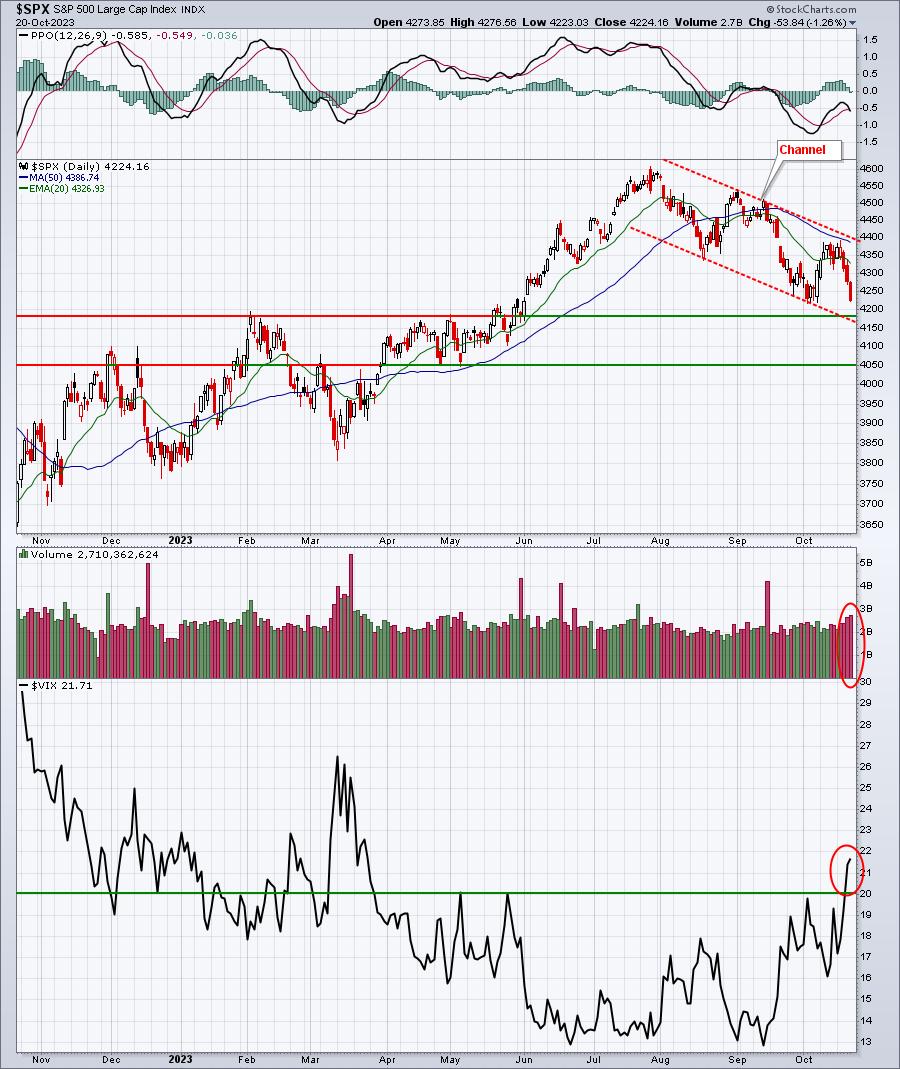
The VIX breaking above 20 is a warning sign, but I believe it's more important that the S&P 500 closed on its low on Friday on increasing volume. This is NOT capitulation. In fact, it reeks of further selling ahead, until we see capitulation. Selloffs can be MUCH more brutal when price support is lost with a VIX above 20. So technical issues are telling me to be very careful.
Historical Bearishness
Next week is the absolute WORST week of the year historically, dating back to 1950 on the S&P 500. While the S&P 500's average annual returns are approximately +9% over the past 73 years, check out the following annualized returns by calendar day on the S&P 500 over those same 73 years:
- October 22nd (today): -90.58%
- October 23rd (Monday): -5.14%
- October 24th (Tuesday): -32.64%
- October 25th (Wednesday): -36.65%
- October 26th (Thursday): -56.01%
- October 27th (Friday): -24.27%
Those numbers are a far cry from the S&P 500's average annual return of +9%.
And if you think things are better historically on the NASDAQ, think again. Here are the annualized returns by calendar day on the NASDAQ since 1971:
- October 22nd (today): -58.57%
- October 23rd (Monday): -46.02%
- October 24th (Tuesday): -64.64%
- October 25th (Wednesday): -25.00%
- October 26th (Thursday): -106.39%
- October 27th (Friday): -78.14%
Now I'm not providing any guarantees about price action next week. Rather, I'm talking about tendencies and probabilities. The VIX is screaming at us to be very careful, price action is suggesting lower prices ahead, and history shows very bearish tendencies in the week ahead. Personally, I do not ignore those warning signs.
The Silver Lining
The primary silver lining for me is that every important signal I follow says this weakness will be short-lived and that the current secular bull market will return stronger than ever. The track record of these signals has been very strong for a decade. The other silver lining, however, is that historical tendencies will soon flip to the side of the bulls. I'll be providing some of those bullish historical clues in our free EB Digest newsletter over the next few weeks. EVERYONE should know these tendencies. And if you'd like IMMEDIATE access to a special FREE Money Flows report and receive additional clues in our EB Digest newsletter, CLICK HERE to download this report right now!
Happy trading!
Tom


