I'm sure most of you, by now, know that I'm a student of history. 2023 played out beautifully and mostly according to its historical road map. Here are a couple things in 2023, with respect to the S&P 500, that could have been predicted simply by being aware of historical norms.
Q4 Strength in Industrials and Financials
Industrials (XLI) and financials (XLF) LOVE the fourth quarter. I've pointed it out on many occasions. During this secular bull market advance since 2013, financials haven't outperformed the overall market. Rather, the sector has been roughly equal to the benchmark S&P 500. But the September through December period is when the XLF has shown nice relative strength:
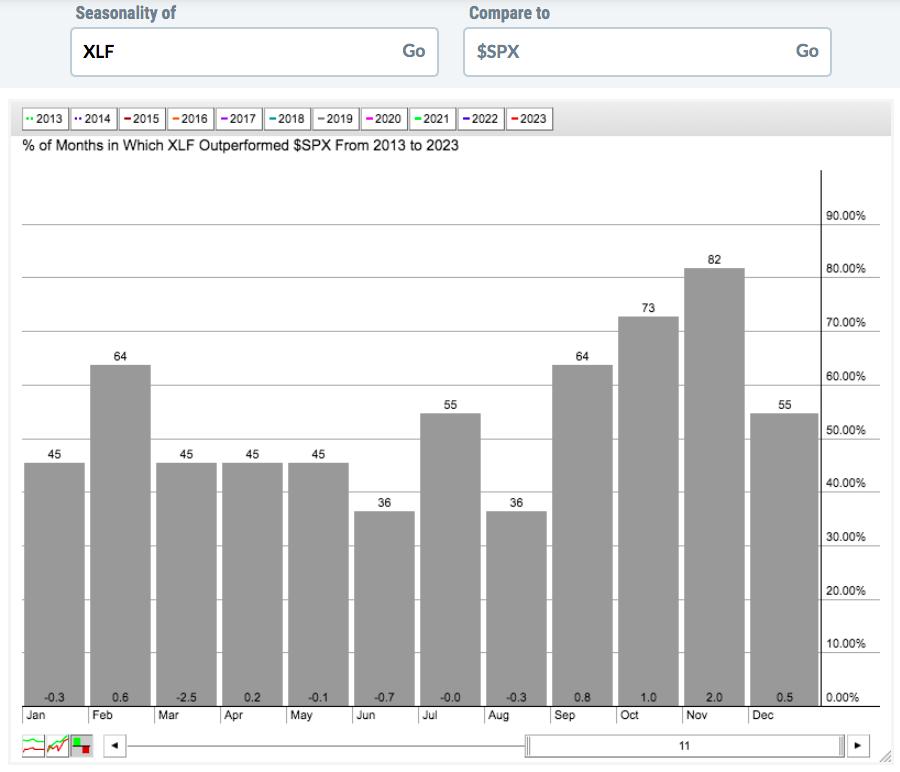
Here's how the XLF has performed relative to the S&P 500 since 2013:
- January through August: -3.1%
- September through December: +4.3%
Now check out the XLF:$SPX relative chart:
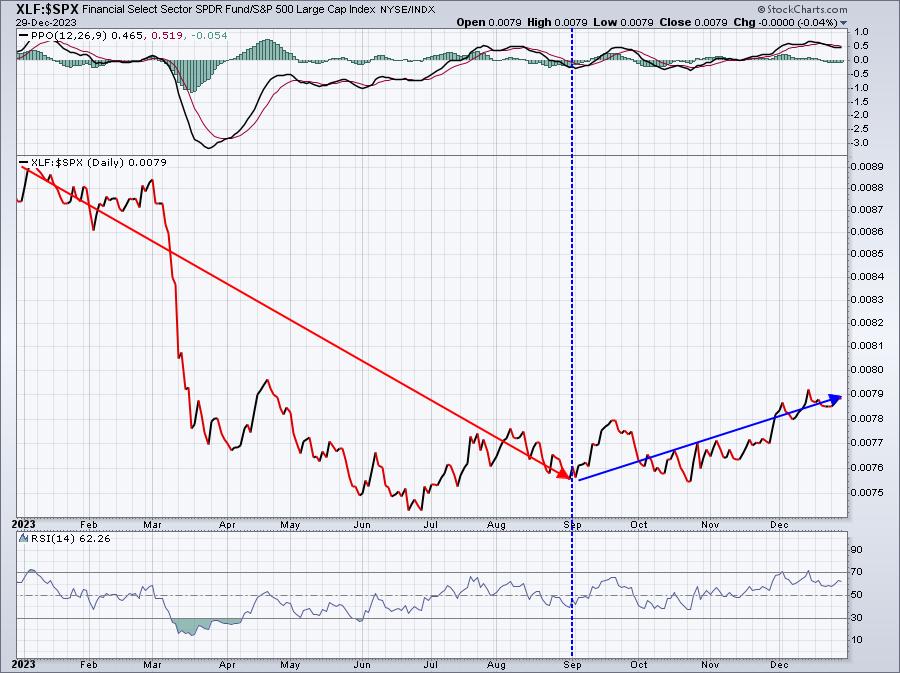
It was like clock work.
Industrials (XLI) aren't much different, though their strength is clearly found in November. Here's that same 11-year relative seasonality chart since 2013, but this time featuring the XLI:
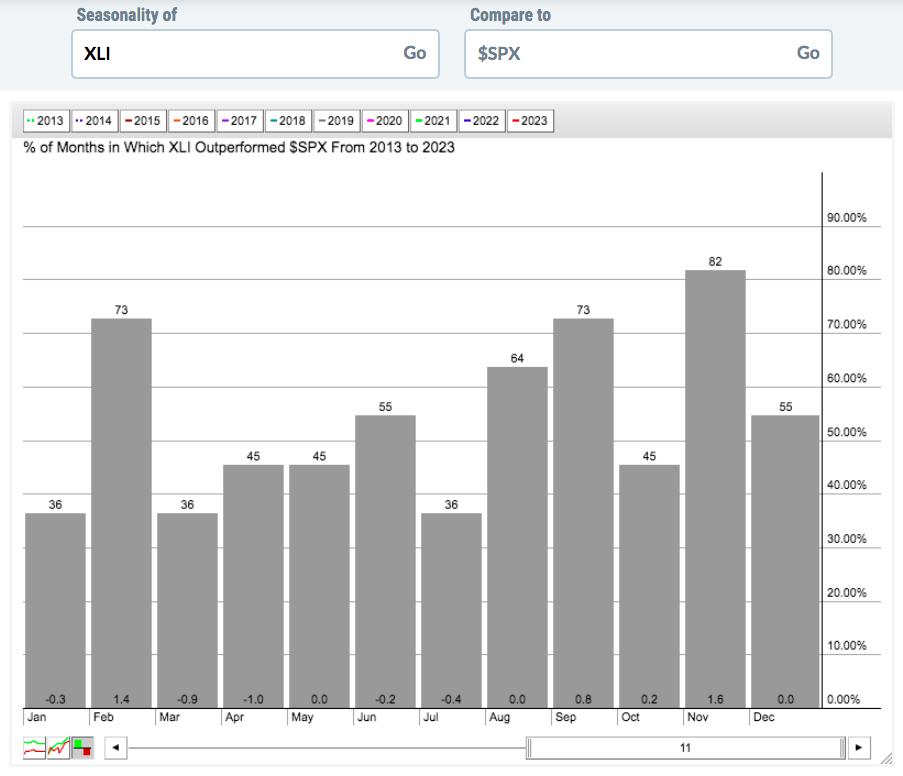
Let's break this one down by the same two periods of the year:
- January through August: -1.4%
- September through December: +2.6%
And here's the chart:
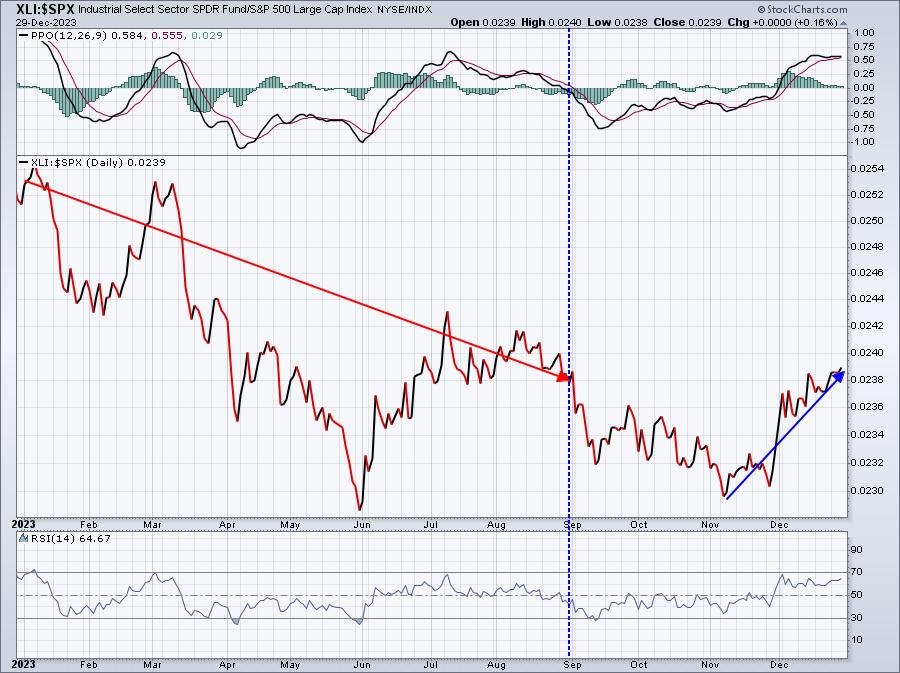
It took a little while to get started, but that November/December explosion occurred perfectly into industrials' seasonality sweet spot.
October 28th Through January 18th Most Bullish Period of Year
I don't know if you were watching, but the correction bottom printed on October 27th. As soon as the market opened on October 28th, the S&P 500 exploded higher and it hasn't looked back. Check out this chart:
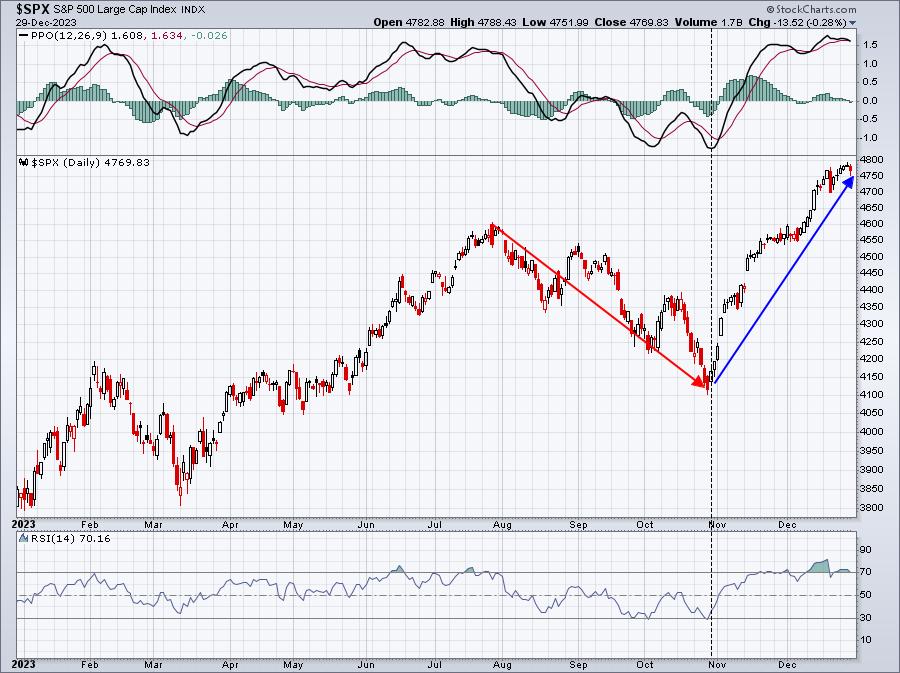
What changed on October 27th to the 28th? Seriously, did anything change other than the flip of one day on the calendar? I've said in the past that late-October bearishness to November bullishness is like flipping a switch or simply turning the cold water to hot. History nailed it - AGAIN.
The strongest October 28th through January 18th period EVER on the S&P 500 (well, since 1950) was in 1962-1963, when the S&P 500 gained 19.51%. The second best since 1950 was in 1998-1999, when the S&P 500 gained 16.70% during this bullish period. The third best? Well, right now it's 2023-2024. The S&P 500 is currently higher by 15.85% since the close on October 27th. If the S&P 500 closes above 4921 on January 18th, it will set a record for the largest gain from October 28th through January 18th - since 1950.
Now you're probably thinking that these strong October through January periods would likely lead to a lot of selling after these periods end, right? I mean, my goodness, we'd have to be incredibly overbought, just like we are now, right? Well, you might want to sit down, if you're not already sitting.
Check this out.
Of the TOP 20 BEST October 28th through January 18th periods since 1950, 19 of 20 ended the subsequent calendar year higher. 13 of those 20 years produced double digit gains! And of 26 October 28th through January 18th bullish periods that gained 8% or more, only ONE subsequent year fell by double digits. It was year 2000 as the S&P 500 fell 10.14%. So I ask, where does the risk lie now? With those sitting out, waiting for a pull back or, worse yet, a bear market? Or is it with those that buy at current stretched prices?
If you're thinking this bullishness can't last or it makes no sense to chase this rally, well, history suggests otherwise. Ultimately, however, the call is yours.
Since I discussed the most bullish historical period of the year, I should mention that the weakest period is from the July 17th close through the September 26th close. Look up at that S&P 500 and check out the 2023 correction. When did it occur? Yep, it started in mid- to late-July and ran through September, even into October.
History nailed 2023 in so many respects.
S&P 500 2023 Performance
Let's take a trip down memory lane, shall we? Here's where the S&P 500 stood one year ago today, on December 31, 2022:
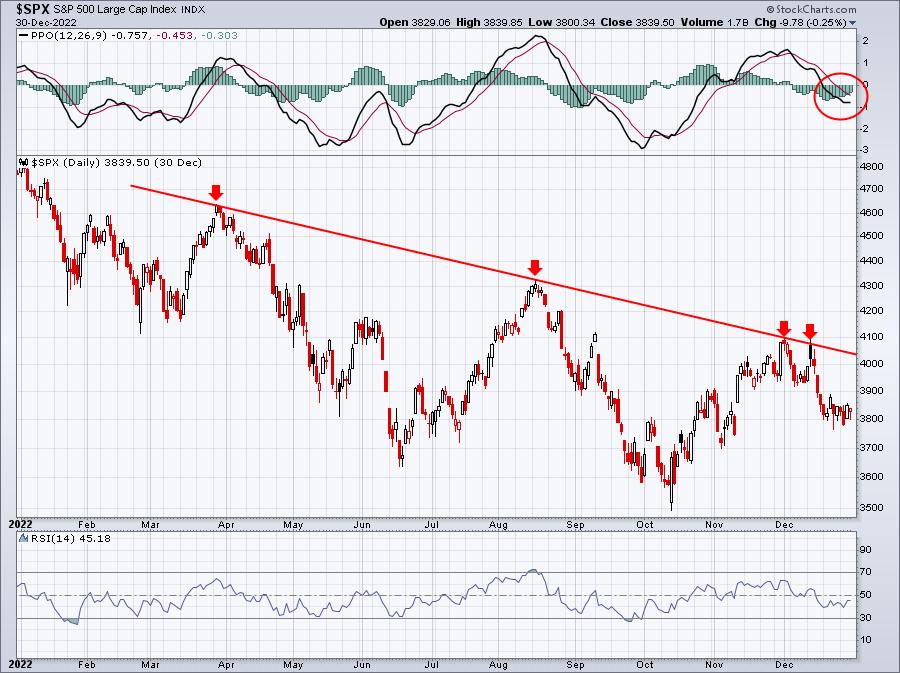
Remember? It was ugly. Do you remember how many analysts were saying we were heading lower? How many at that time were bullish? Can you reach five fingers on one hand? I can't. I felt like I was on a bullish island, all by myself. I don't really care, though. I don't need others to agree with me. I'm not trying to follow the crowd. Instead, I completely ignore the crowd and follow my charts and my signals. And I KEEP PERSPECTIVE at all times. It allows me to take a step back and make an unbiased call, based on the facts and RISKS at hand - not based on the opinions of every media "expert", most of whom do little research to back up their calls. Do you remember what everyone was saying? Here's a partial list...
- Don't Fight The Fed
- Now Rate Cuts Are Coming (contradiction is ok on Wall Street, apparently we shouldn't invest when the Fed raises or cuts rates)
- Go Away in May
- Breadth is Too Narrow
- Now Breadth is Too Extreme (again, contradiction central - lagging breadth and extreme breadth are both bearish)
- It's Only the Magnificent 7
- Runaway Inflation
- Politics
- Government Debt
- Consumer Debt
- Negative Divergences
- Trendline Breaks
- Bullish Sentiment (I also love this one, because sentiment remained incredibly bearish in 2023 until November, in my view)
- and blah, blah, blah
Where did I stand? Well, I put my reputation on the line at the beginning of every year, making a convicted prediction for the the S&P 500. On Saturday, January 7th, 2023, at MarketVision 2023, I argued my case for the S&P 500 to rise to 4700 during 2023, potentially testing all-time highs on the S&P 500 near 4800 and ending with a 23% gain. Many laughed and thought I was crazy. The S&P 500 actually gained 24%, and I was off by 1%. My bad. Now here we are, one year later, and the S&P 500 just closed out the year at 4769 and tested 4800 all-time high resistance last week. Call me crazy, I don't care.
I'm ready for an encore.
But first, do me a favor. Actually, two favors.
#1 - Ignore all the usual perma-bear and perma-bull biases and follow me at EarningsBeats.com. I'll give it to you straight, based on the signals I see and risks inherent in the market - bearish or bullish. The best way to become acclimated with my style is to sign up for our FREE EB Digest newsletter. It's a 3x per week newsletter that's very simple to read. It's 2 paragraphs and a chart, 3x per week. And did I mention it's absolutely FREE? CLICK HERE to register with your name and email address. You may unsubscribe at any time.
#2 - Join me this Saturday, January 6th, for "MarketVision 2024: Beyond The Fed". It's a live virtual conference that all begins at 9:30am ET and runs roughly 5 hours. Grayson Roze, Director of Operations here at StockCharts.com will be joining me. You can learn more about this event and register HERE. It will be recorded, so you can listen to the event LIVE or via the recording at your leisure. If you want to fully understand how to follow the signals and ignore CNBC, then MarketVision 2024 is where you want to be.
Get your resolutions for 2024 in order now and kick it off with EarningsBeats.com. You won't regret it.
I've provided unparalleled market guidance and S&P 500 forecasts for the past 4 years and they've been eerily accurate. I'm ready to put my reputation on the line once again this Saturday. I hope you will join me!
I'm wishing all of you health, happiness, and financial prosperity!
Happy New Year and happy trading!
Tom


