Last week, in my Weekly Market Report to EarningsBeats.com members, I pointed out the upcoming bullish history of the small cap Russell 2000 Index (IWM tracks this index). Most probably have no clue why small caps outperformed by such a wide margin this week. But history saw it coming all along. Here are the daily annualized returns on the Russell 2000 since 1987:
- November 23: +63.10%
- November 24: +255.15%
- November 25: +78.57%
- November 26: +22.50%
- November 27: +28.95%
- November 28: +72.16%
- November 29: +38.77%
- November 30: +44.22%
- December 1: -39.02%
- December 2: +121.88%
- December 3: -26.06%
- December 4: +22.88%
- December 5: +157.14%
- December 6: +52.01%
- December 7: -34.93%
- December 8: +90.60%
There's a lot of historical tailwinds at our back right now. It's a clear seasonal indication that the IWM LOVES this time of year. Historically, the IWM's best two calendar months are December and November, which have produced annualized returns of 25.08% and 17.46%, respectively, since 1987. Only three other months are even in double digits: April (+15.25%), May (+13.10%), and February (+12.89%).
So should we be shocked to see the following IWM chart:
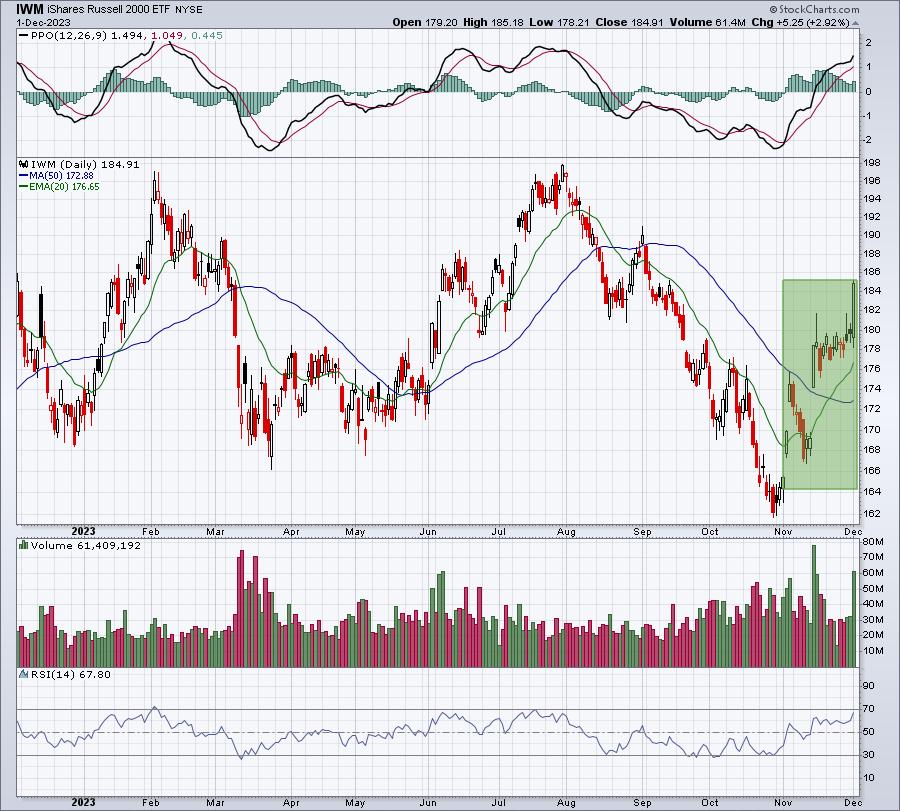
It's easy to see what's happened thus far in November/December. And just think, December is typically stronger than November and it's just getting started.
Looking at the IWM another way, this time from a technical perspective, also yields a very bullish December outcome:
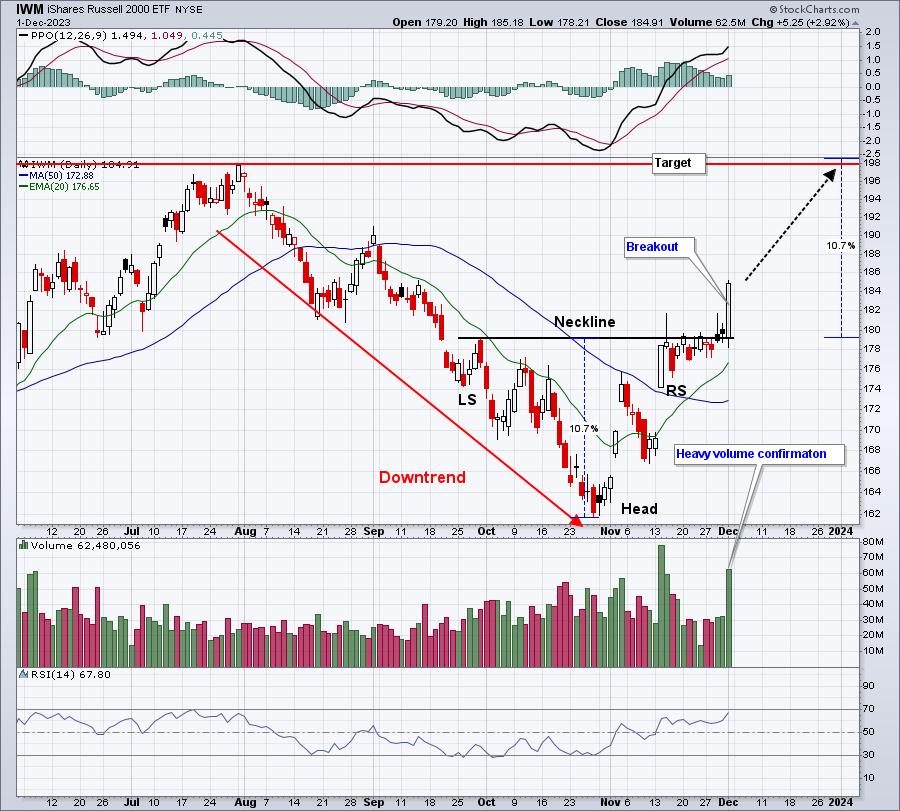
I see a beautiful reverse head & shoulders bottoming pattern that executed today. Volume soared to accompany the price breakout above the neckline. Listen, none of this is surprising to me. I've been telling members since June 2022 that the longs were in a much better position than the shorts. It was time to STOP shorting in June 2022. The S&P 500 is now up 1000 points off the ultimate October 2022 low. The NASDAQ 100 has risen nearly 50% from the June 2022 bottom.
And you know what? We're going higher. A lot higher.
To improve your own trading success, answer these two questions honestly:
(1) Do you know there's a 12-consecutive day period of EVERY calendar month that has produced more than 80% of the S&P 500's gains since 1950? In other words, a little more than 33% of all trading days have accounted for more than 80% of the market's gains. Do you WANT to know what that period is? I would certainly hope so!
(2) Do you know the trading behavior of each calendar quarter? That knowledge recently led me to very profitable trades on both NVIDIA Corp (NVDA) and Tesla, Inc. (TSLA), 2 of 16 key stocks that I've done extensive historical trading analyses for. Want to improve your trading success with simple seasonal data? Why wouldn't you?
I want to introduce you to "Bowley Trend: Long-Term Trends Since 1950". It's a 7-page PDF that I want you to immediately download and keep as yours. Consider it a "Thank You!" for following my work over the years. Learn the secrets that few traders know. Take one minute, CLICK THIS LINK, and download my FREE PDF that will change the way you look at the stock market forever!
Happy trading!
Tom
