No one loves a good bull market more than me. History tells us that we want remain mostly on the side of the bulls. Perma-bears have an awful long-term track record. They've called 30 of the last 3 secular bear markets. Honestly, those who cannot ever see anything other than a downtrend ahead should find a new occupation or hobby. Here's the long-term chart of the S&P 500.
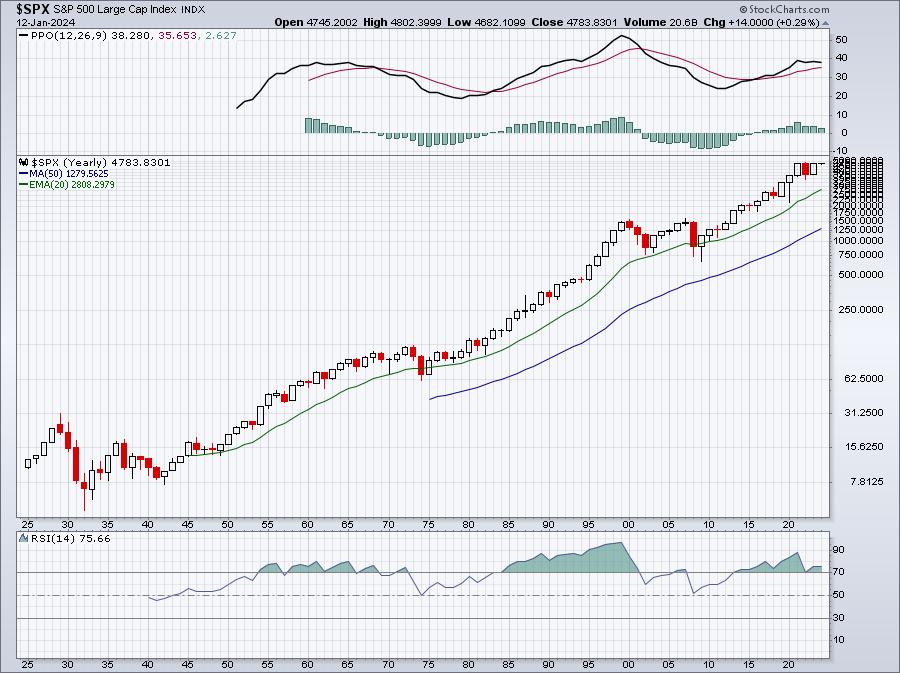
GDP + inflation + innovation = roughly an average 9% annual gain on the S&P 500. Ask yourself a question. How many times have you exited the stock market and wished you had just left your investment alone and untouched? Be honest.
Seriously, how often do perma-bears get it right? Hey, listen, there's nothing wrong with being bearish from time to time if you're a shorter-term trader. The stock market moves too far sometimes and rightfully needs to correct. And after years of secular bull market strength, there comes a time when stocks need more than a simple correction and a secular bear market is justified. In my opinion, that's not now. Talk to me again in 2030. We won't be in one for a long time as the current 11-year secular bull market rages on. But, even during a secular bull market, the bulls must acknowledge when short-term risks grow and portfolio adjustments should be considered.
I believe now is a good time to lean on perspective and the impact it could have in 2024.
We all know (or should know) that the three aggressive sectors - technology (XLK), consumer discretionary (XLY), and communication services (XLC) - tend to lead most secular bull market advances. But they don't lead all of them. And there are examples right now that maybe our leaders have led for a bit too long.
The S&P 500 just advanced more than 16% in 41 trading days from October 27th through December 28th. We can use a 41-day rate of change (ROC) to see how often this 16% level is reached or exceeded in this time frame. Check this out:
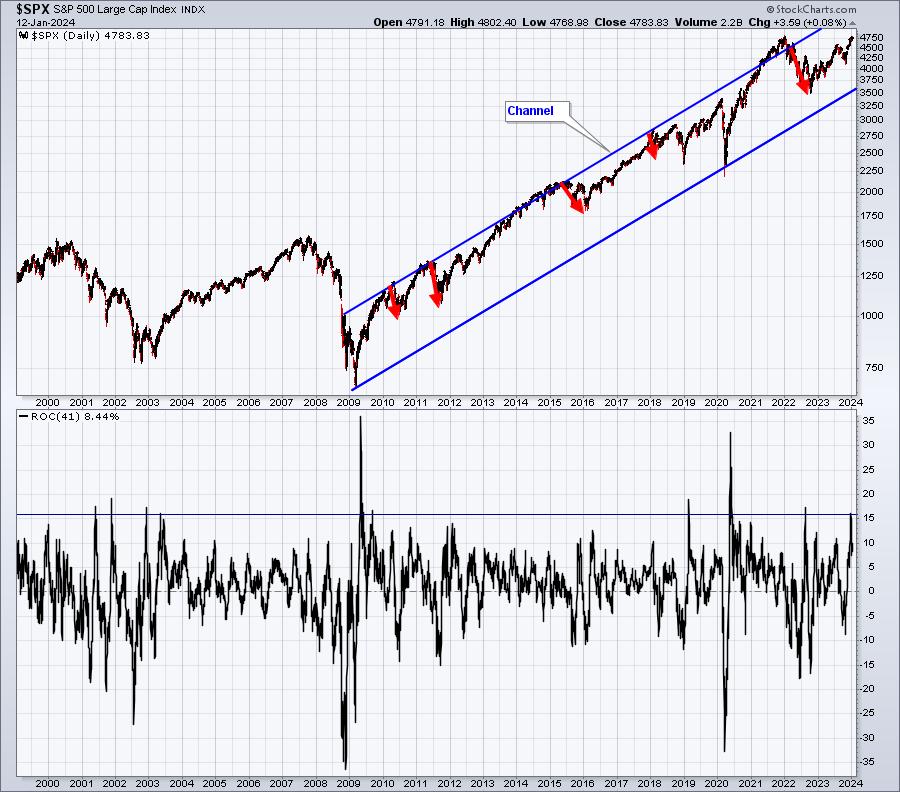
This type of move typically occurs after a big bear market move lower or after a correction. The 2023 occurrence came on the heels of the July through October correction. These huge gains are not normal and rarely result in similar gains moving forward. We need to pause and allow these gains to be absorbed. Also, election years are weak historically during Q1, which is exactly where we're situated right now. While I expected a scorching January in 2023 based on a few of my signals, I don't expect that at all in January 2024. Lows in election years tend to coincide with March.
Currently, the largest sector in the S&P 500 is technology, which represents 28.79% of the benchmark. Discretionary represents 10.84% and communication services totals 8.55%. So these 3 aggressive sectors comprise 48.18%, or nearly half of the benchmark. If these 3 groups simply take a few months to absorb recent gains, we could easily see rotation move into other areas like industrials (XLI), financials (XLF), or health care (XLV). These 3 more value-oriented sectors represent more than 34% of the benchmark. While XLY is in the aggressive sector camp, it actually looks like it could still provide a lift to the S&P 500. More on that below.
Technology (XLK) is clearly the one to watch though as it has the biggest impact on the S&P 500. Currently, from this chart alone, I see significant risks ahead if you're overweighting technology:
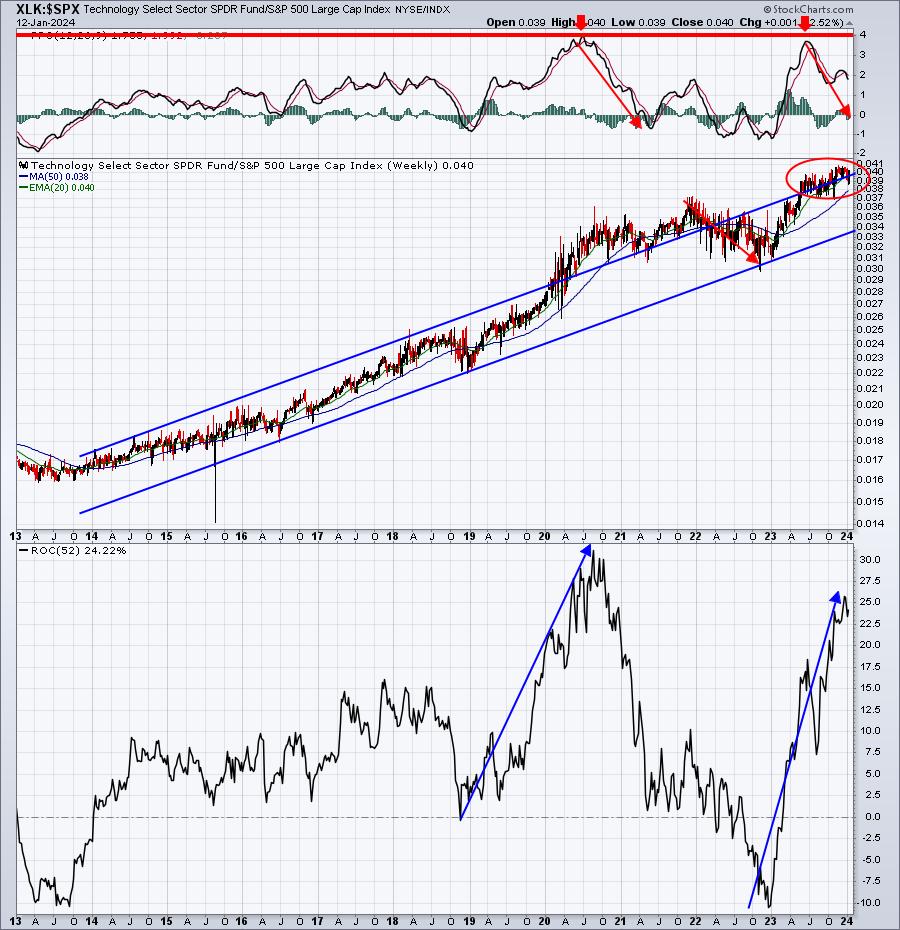
Nothing on this chart looks particularly encouraging for technology. The top part of this chart tells us that technology's relative momentum was VERY stretched - similar to 2020 - and we know what happened next. It was a lengthy period of average to underperformance vs. the S&P 500.
The middle part of the chart shows that the XLK:$SPX relative strength is at the upper end of its relative uptrend, which makes it difficult to continue outperforming. In fact, it's probably time to consider weak relative strength ahead. Finally, the bottom panel charts the 52-week relative performance. Money has poured into technology over the past year - again similar to 2018. It wouldn't be normal for this to continue higher. Once again, this tells me the risk is to the downside and it's not worth the risk of overweighting technology right now.
I'll make one last point about the likely relative weakness in technology. Check out this 20-year weekly chart of the XLK:
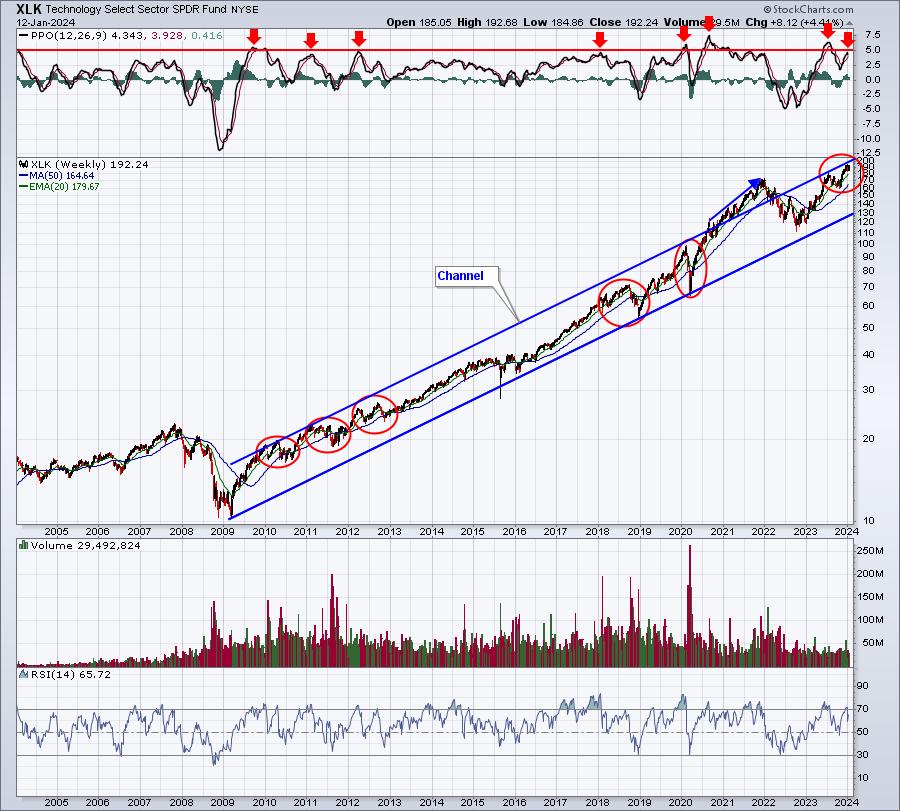
We're at the top of the XLK's 15-year channel, which has been problematic at every point in this channel, with the exception of the after-effects of the pandemic. It just looks like time for a change in leadership for a bit.
So all of this leads me to a big question. If technology underperforms, where should we look for relative strength?
XLY:

The XLY is trading much closer to its lower uptrend line, suggesting strength could easily find its way here.
XLV:
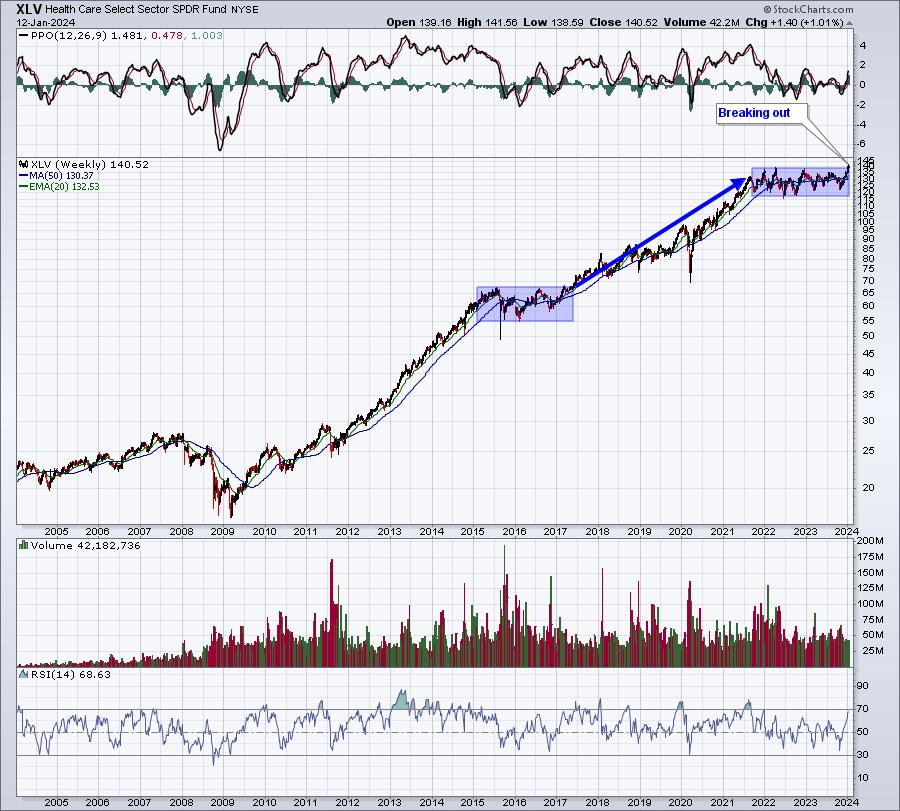
The XLV has been consolidating and, therefore, underperforming the S&P 500 for quite awhile. The recent breakout may be the trigger this group needs to see a lot more money rotating IN.
XLF:
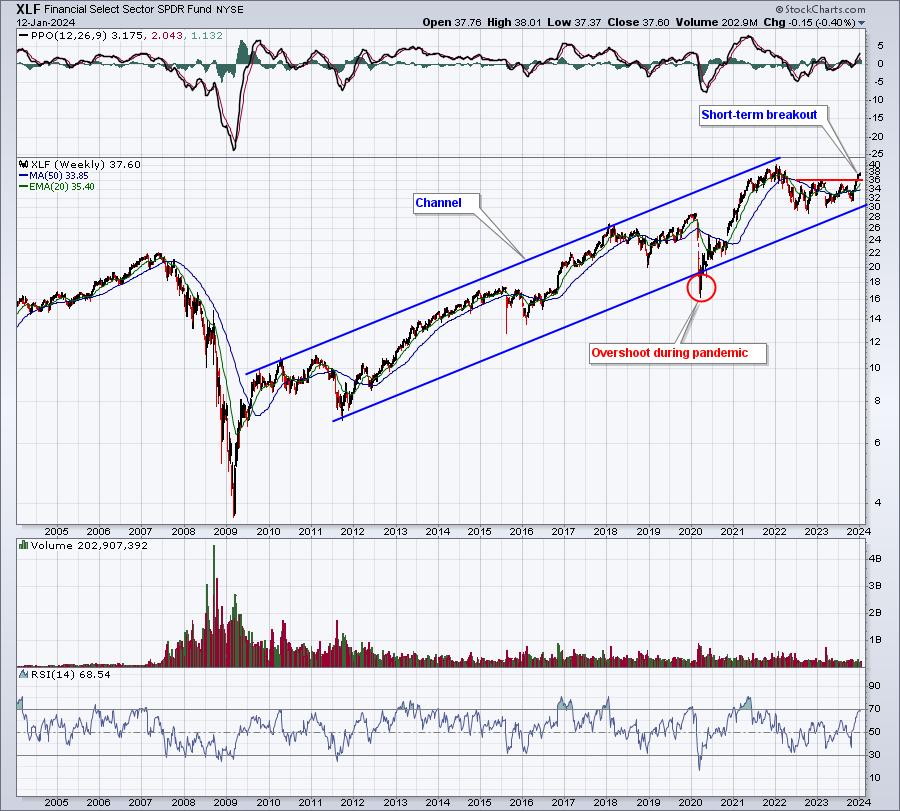
Technically, we don't usually see this group lead. Given the circumstances of the 2008-2009 financial crisis, the XLF has been a tough place to make money. But I believe the group was undervalued while short-term rates jumped and resulted in an inverted yield curve. 2024 is likely to reverse that condition, which will benefit the net interest margin for banks ($DJUSBK), a significant fundamental tailwind. Should our economy grow in 2024, which I believe it will, it could be a goldilocks scenario for banks - a solid, and perhaps even improving, economy coupled with rising spreads.
It will be very interesting to see how the first quarter of 2024 develops. While I can't guarantee outperformance or underperformance of any area, I do believe that we can assess risk and make more informed trading/investing decisions.
To become a FREE EB Digest subscriber (no credit card required) and to follow me at EarningsBeats.com, simply CLICK HERE and enter your name and email address. You may unsubscribe at any time.
Happy trading!
Tom


