Tops and bottoms are so much fun to predict, but key signals are not always accurate. That's where a healthy dose of skepticism comes in. At EarningsBeats.com, we try to put as many signals together as possible, looking for corroboration. That helps to build confidence in the signals. For example, I turned short-term cautious last week for a few reasons.
First, I'm a student of history and I know that the period from the July 17th close through the July 24th close is the 3rd worst week of the year historically. That covers all trading days since 1950 on the S&P 500 and since 1971 on the NASDAQ. The annualized returns for this July 17-24 period on the S&P 500 and NASDAQ are -16.37% and -32.12%, respectively. Also keep in mind that the worst period of the year is NOT May 1st through October 31st as the "go away in May" folks, who obviously do little research, would have you believe. Instead, it's July 17th through September 26th. During this period, the S&P 500 and NASDAQ have produced annualized returns of -2.36% and -5.40%, respectively. That may not seem like much, but consider that the -2.36% annualized return on the S&P 500 covers 3,643 trading days since 1950. That's the equivalent of 14+ years. How excited would you be about investing if I told you that the S&P 500 would go down an average of 2.36% per year through 2038? Probably not too excited. Well, that's the equivalent of what has happened during this bearish period since 1950. The NASDAQ's -5.40% annualized return for the same period covers 2622 trading days, or roughly 10 years. This is just a small sample of the quality research that we provide our members every day.
Second, last week was max pain week. That's the week when monthly options expire. This is generally a very difficult period for U.S. equities and last week was no exception. Every month, we provide our members a list of approximately 135-140 stocks, showing their closing price as of the Friday before monthly options expiration Friday. We then provide each stock's max pain price, which essentially is the price point at which market makers would pay out the least amount of options premium. Let me give you a few examples of how this worked so beautifully last week. Below I'm providing stock symbols, their closing price (CP), their max pain price (MP), and their low price (LP) last week:
- NVDA: 129.24 CP, 100.89 MP, 116.56 LP
- AMZN: 194.49 CP, 172.48 MP, 180.11 LP
- AMD: 181.61 CP, 160.07 MP, 150.62 LP
- MSFT: 453.55 CP, 426.13 MP, 432.00 LP
- AMAT: 243.40 CP, 217.99 MP, 210.26 LP
Do you see the value in knowing about max pain? It literally saved many of our members thousands of dollars. I don't use this information to guarantee me that a stock is going to drop to its max pain price. Instead, I use this information as a directional clue, no different than a positive or negative divergence, key price support or resistance, overbought and oversold territory, etc. It's simply one more clue that max pain provides. And I'd say the clue was quite helpful for July.
Next, how about the reversal just as the 5-day SMA of the equity only put call ratio ($CPCE) hit a key complacency level that tends to mark tops?
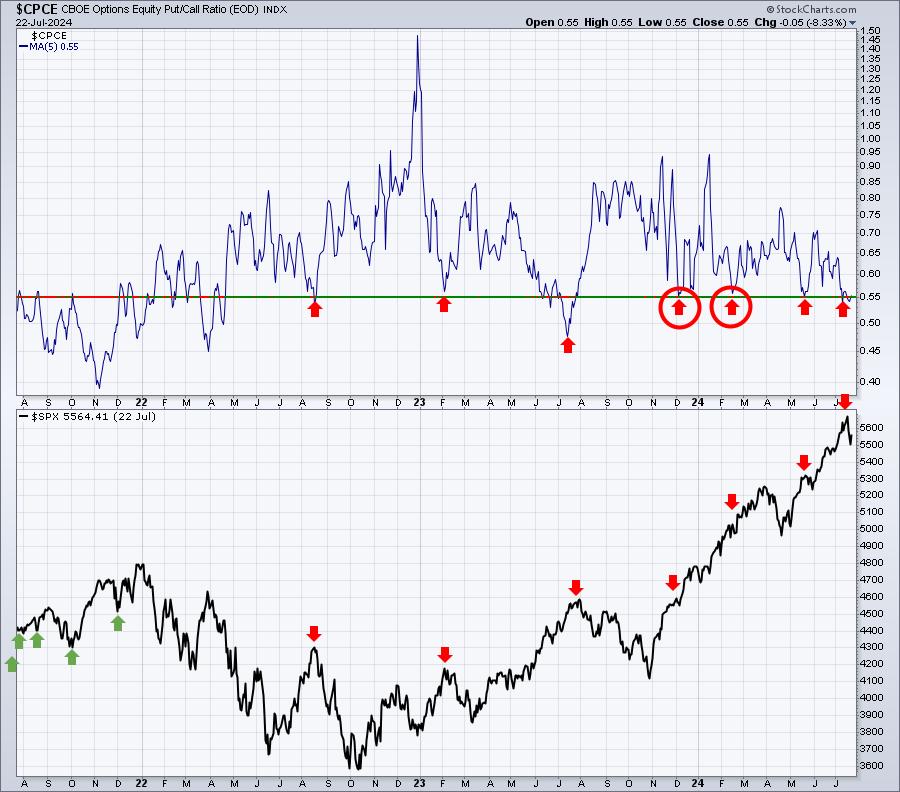
The red circles highlight the two times that this signal didn't work out well, but plenty of others worked just fine, especially last week's, tipping us off to a reversal to the downside.
Finally, any time I see the correlation between the S&P 500 and the Volatility Index ($VIX) turn positive, the odds increase that we'll see a reversal in the S&P 500 - either lower off an uptrend or higher off a downtrend. Check this latest positive correlation that once again sparked a reversal:
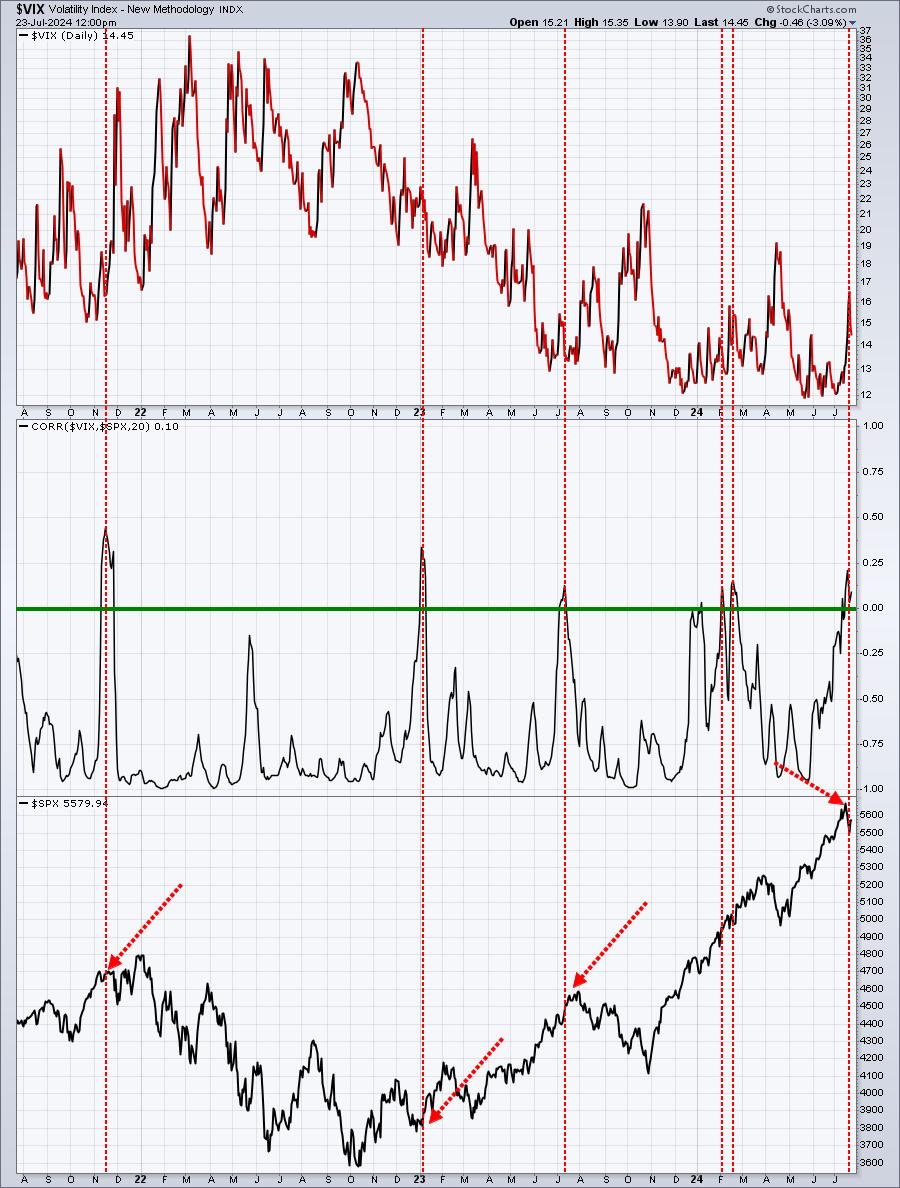
You can see that the VIX and SPX move opposite one another most of the time, resulting in a correlation that is almost always in the -0.50 to -1.00 range. Trips above zero, however, do offer a hint as to a possible market reversal and this latest signal also worked again. Remember, these are ALL short-term cautious signals, not long-term.
What To Look For Longer-Term
There's a TON to watch, but let me give you 3 short-term technical clues I'll be watching, in order of importance:
- Technology (XLK)
- Semiconductors ($DJUSSC)
- NVIDIA Corp (NVDA)
It's no secret that technology represents 32% of the S&P 500 and 50% of the NASDAQ 100. If this group breaks down, the odds of a further drop would increase significantly. Let's look at the XLK:
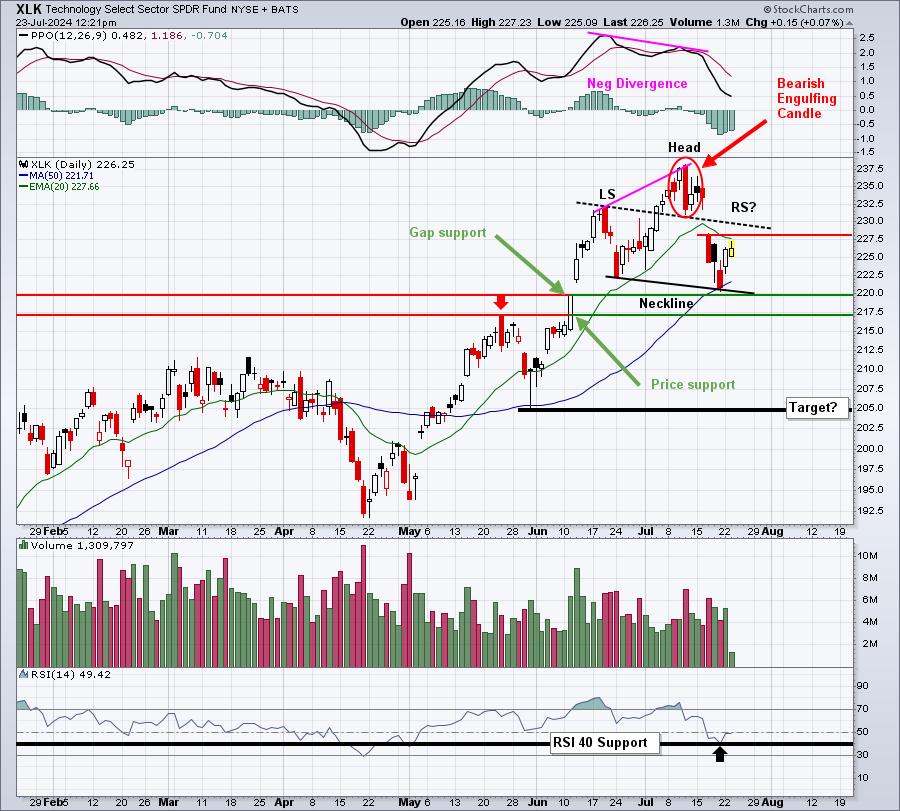
Let me say that bearish patterns forming during secular bull markets MUST confirm. I give the benefit of the doubt to the bulls every single time during a secular bull market advance, which is exactly what we've had on our hands since the April low. But we have external factors like the Fed that could quickly change the technical picture, which is why I'm watching these other signals so closely.
This is an absolutely CLASSIC head & shoulders topping pattern. All of the markers are present. First, a negative divergence printed with a bearish engulfing candle at the top. The resulting low changed the character of the chart, at least temporarily, by printing a lower low. Note that the selling did stop at the 50-day SMA and also above both gap support and price support. Unfortunately, we're left with a down-sloping neckline, which if violated, would be much more bearish. The bounce that we're seeing could be the formation of an important right shoulder at the now-declining 20-day EMA and/or the bottom of gap resistance, or possibly slightly higher to rein in the last buyers before a much more significant decline. The measurement of this head & shoulders pattern, if executed, would be roughly 205, a far cry from the current 226 level.
We should also keep an eye on the RSI. The bounce off 40 was beautiful, but normal bull market pullbacks touch that level and then take off. A return trip to RSI 40, or below, would start to paint a more bearish picture.
Next, semiconductors:
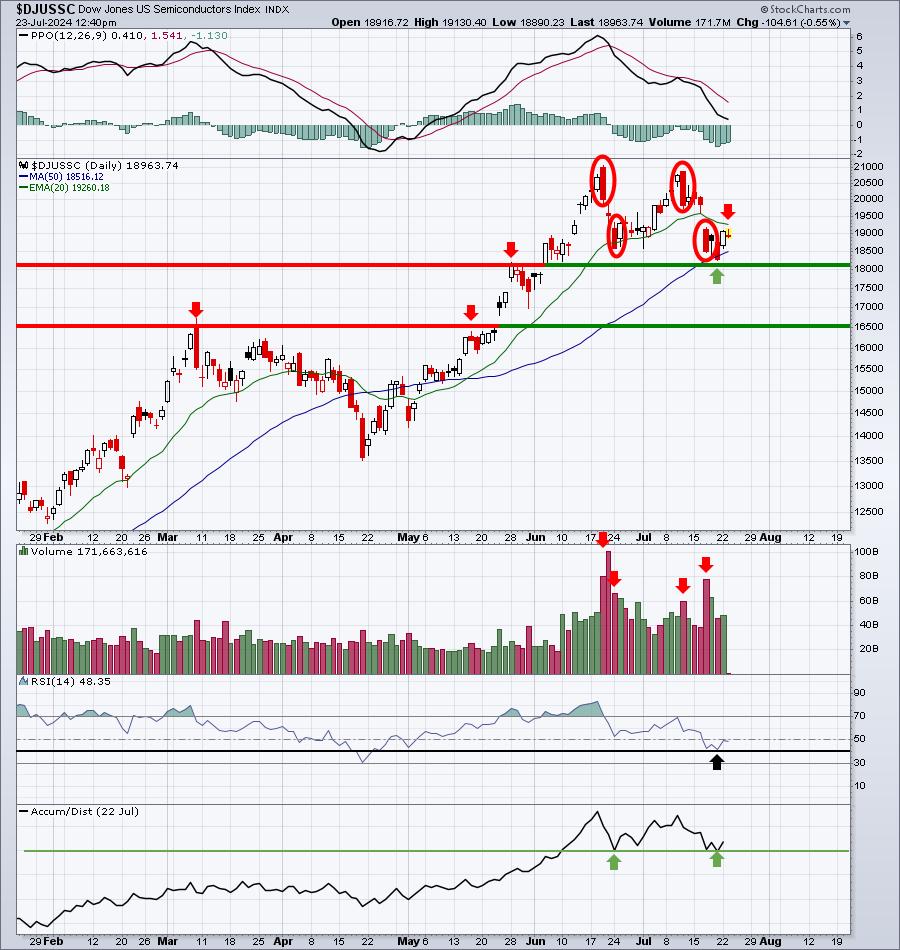
Semiconductors will be the primary key for technology. This chart doesn't look a whole lot better than the XLK chart itself. I circled 4 very bearish days in the past month that suggest significant distribution. Prior to mid-June, I don't know if we had 4 similar days earlier in all of 2024. RSI support is teetering with one test already at 40. We have a double bottom on the AD line and a rapidly-deteriorating PPO, though, for now, it remains above centerline support. We don't have a major breakdown just yet, but key warning signs are there. And the semis represent a huge chunk of the XLK. I'm not showing it here, but the DJUSSC has a negative divergence on its weekly chart, so short-term breakdowns could become much more severe.
Working our way down the totem pole, next up is NVIDIA Corp (NVDA), which has problems of its own. Because it's the poster child of semiconductors, a breakdown in this critical stock would be very detrimental to both the semiconductor group and technology, as a whole. Check out NVDA and zero in on its key areas of support:
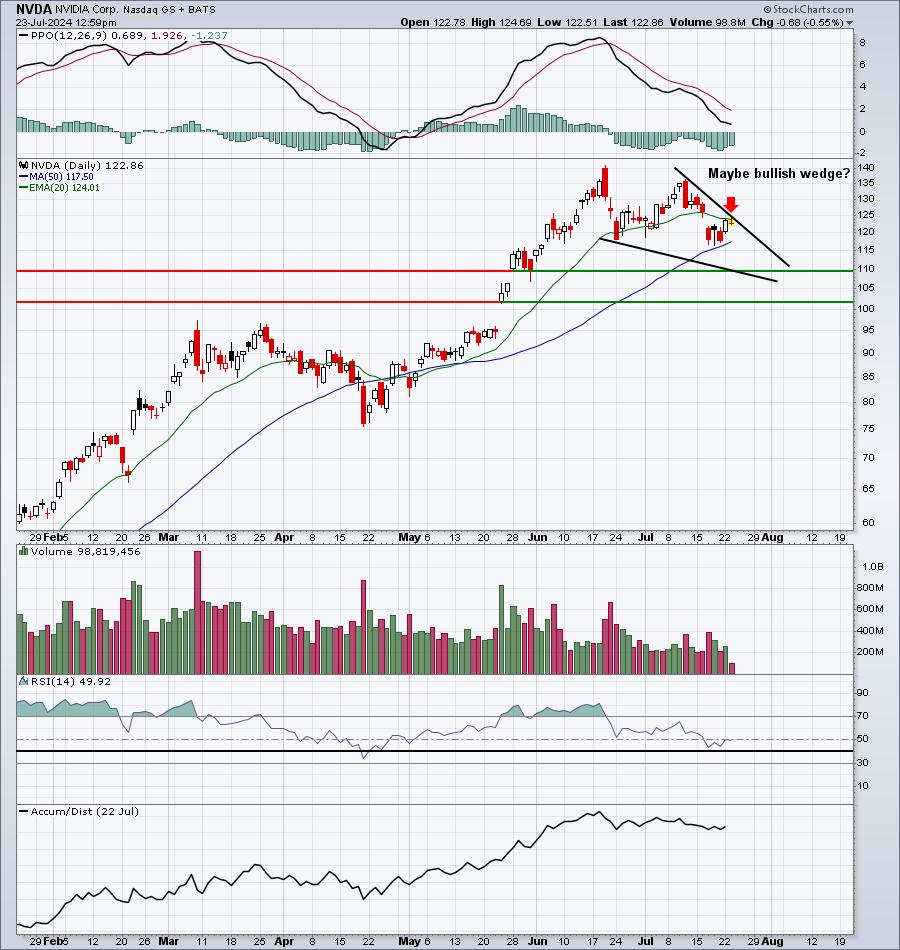
Listen, here's your leader in semis. Everyone will be watching to make sure NVDA holds support. Make no mistake, I am BULLISH NVDA, the semis, and technology over the long-term, but could Q3 be a problem? Yes, it very well could.
To conclude, I'm worried about the market here. I see issues building not just on the charts above, but within our economic structure. The Fed may have a lot to say about how deep the current selling/downtrend goes. I'm not a fan of Fed Chief Powell and I've been quite vocal about the Fed's delay in cutting the fed funds rate. This lack of rate cuts is just now beginning to show up in deteriorating economic conditions. This is important enough that I wanted to hold an event this Saturday for our EB.com members. I'll be discussing the many warning signs that are now popping up, along with what it would take for me to turn much more bearish. If you've followed me, you know that I don't get bearish every other week. I have not been bearish since I said to go long U.S. stocks on June 17th, 2022, during the depths of the 2022 cyclical bear market.
If you would like to join this event, "Why The S&P 500 May Tumble", on Saturday, July 27th at 10:00am ET, simply CLICK HERE to learn more and to register. We are very likely to reach capacity, so please register TODAY. We'll get your FREE 30-day trial started and you'll be able to experience all the benefits of an EarningsBeats.com membership.
Be careful out there!
And, as always, happy trading!
Tom


