We're approaching Q2 earnings season, so I'm getting ready for all the short-term trading opportunities that await. But, in the meantime, there are plenty of other earnings opportunities right now - pre-earnings advances. Several of the large cap names (think Mag 7) are already starting powerful advances. Look no further than Tesla, Inc. (TSLA), which reports its results in just a little more than two weeks on July 23rd. TSLA has exploded higher, seemingly out of nowhere, but if you're a passionate historian, then you know better. TSLA is on our Top 16 list of stocks, where you MUST know seasonal trends. TSLA, throughout this secular bull market, has performed as follows:
- 24th through 7th: +70.08%
- 8th and 9th: -81.09%
- 10th through 17th: +79.17%
- 18th through 23rd: -26.14%
The latest 24th to 7th period (June 24th - July 7th) is now complete since the 6h and 7th fall on a weekend. Check out how this period just performed:
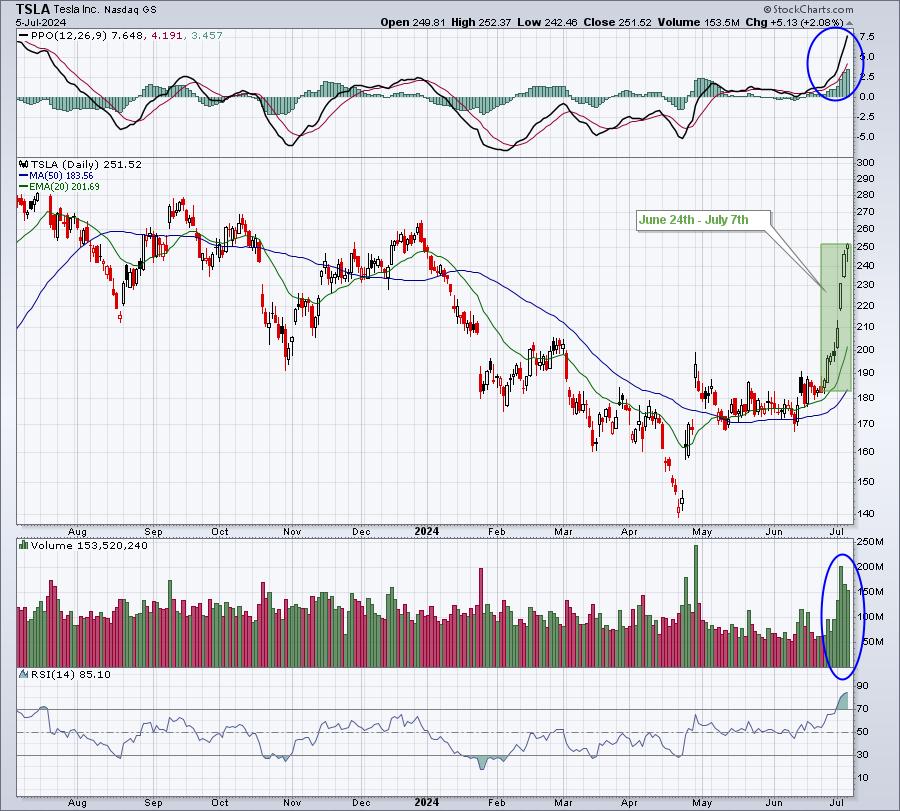
Does history work this well every time? Of course not. History only provides us tendencies, not guarantees. However, if you know TSLA's historical tendencies and you see a breakout above key resistance at 208 on massive volume on July 3rd, that seasonal knowledge can help you pull the trigger. Also, June 24th began this bullish period and TSLA was trading just above its 20-day EMA at the time. Further historical tendencies supported TSLA's advance as well. The first month of calendar quarters (Jan, Apr, Jul, Oct) has easily been TSLA's strongest, which makes perfect sense to me as TSLA reports quarterly results in the first month of each calendar quarter. Pre-earnings advances are common for TSLA and many other large cap stocks.
Want another? Check out Meta Platforms (META). On Friday, META soared and broke out to another all-time high. Historians weren't surprised. First, check out the chart:
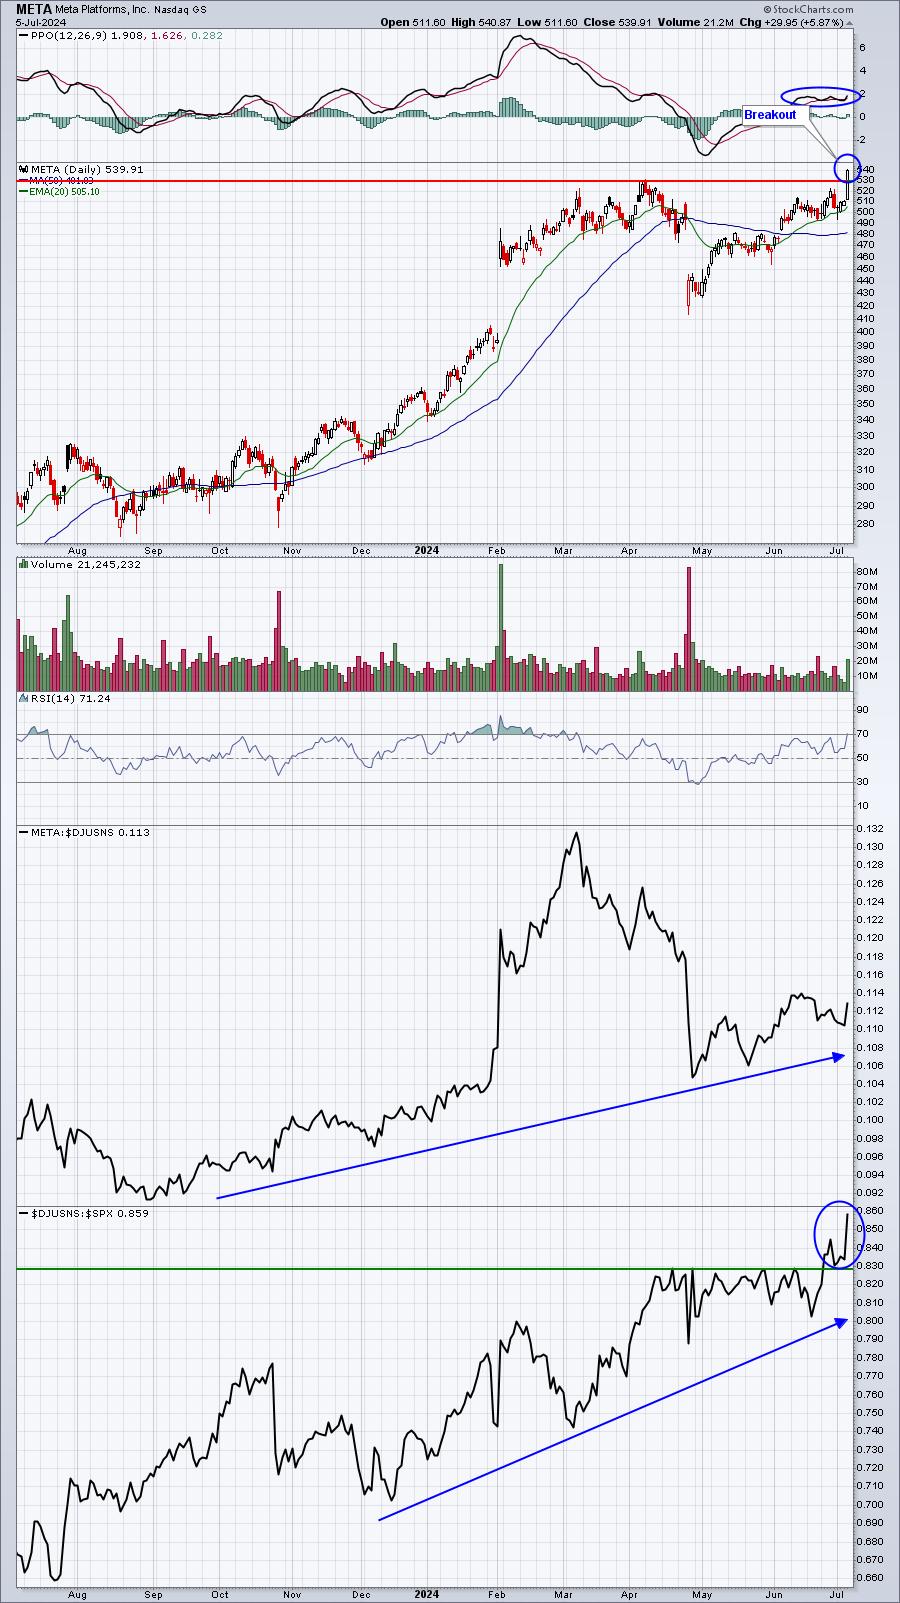
Technically, META's breakout and long-term relative strength are quite bullish. But knowing its seasonal tendencies provides even more confidence to trade META. For instance, check out how META performs during its pre-earnings months:
- Month 1 (Jan, Apr, Jul, Oct): +54.29%
- Month 2 (Feb, May, Aug, Nov): +16.21%
- Month 3 (Mar, Jun, Sep, Dec): +8.40%
These are annualized returns since 2013, when the secular bull market was confirmed. META typically reports its quarterly results late in the first month of each calendar quarter. Its next quarterly report is July 31st, as an example. This current breakout is likely the start of an upside move prior to reporting solid results on the 31st. That is NOT a guarantee, just simply an observation based on history. To further drive home this bullish period for META, consider how it's traded during the first half of calendar quarters (Jan 1-Feb 15, Apr 1-May 15, etc) vs. the second half (Feb 16-Mar 31, May 16-Jun 30, etc):
- First half calendar quarters: +43.11%
- Second half calendar quarters: +9.29%
I believe this historical knowledge is a critical component in becoming an excellent trader. Why not use all the advantages you can muster?
If you enjoy learning about historical tendencies, you need to first learn the tendencies of the S&P 500 in general. Do you know which 11-consecutive day period of the calendar month (roughly 35% of the calendar month) has produced more than 80% of the S&P 500 gains since 1950? You should. Doesn't it just make good common sense that you might trade more successfully with this information? This is just one example of what you'll learn after receiving our Bowley Trend Part 1 report. To claim your FREE copy right now, CLICK HERE. You will automatically be added as a FREE subscriber to our 2x per week (Monday-Wednesday) newsletter, EB Digest, and on Monday, I'll discuss yet another large cap name with likely upcoming strength that you MUST be aware of.
I've also just posted my latest EB Weekly Market Recap video on YouTube. Simply follow this link, "S&P 500 Hits Record High Despite Economic Challenges". If you enjoy our Weekly Market Recaps, please "Like" the video and be sure to "Subscribe" to our YouTube channel. Ring that bell to make sure you catch all of our YouTube videos.
Happy trading!
Tom


