 |
|
Expert Technical Commentary Delivered Straight To Your Inbox
|
| October 7, 2017 |
Hello Fellow ChartWatchers!
Welcome to the latest edition of ChartWatchers, the newsletter for technical analysts, online investors, StockCharts users and more. In addition to this week's articles, don't forget to check out the Site News section (below) for some important announcements and updates about what's going on around StockCharts this month!
Until next time,
- Grayson Roze
Having trouble viewing this email? Click Here to view online
|
|
|
|
NEW! Correlation View for ChartLists!
Earlier this week, we rolled out a powerful new addition to our ChartList Views - Correlation View! The new Correlation View allows you to quickly see correlation values for all of the stocks or funds in any of your saved ChartLists, each calculated against a benchmark of your choosing and over the time period you select. As any experienced investor will tell you, considering correlation is an important aspect of constructing a properly diversified portfolio. With our new Correlation View, we've streamlined that task for you!
To try out the new Correlation View, head over to the Members Dashboard and scroll down to your ChartLists. In the "View As" dropdown menu for any of your saved lists, you'll notice a new option titled "Correlation". Select that and you'll be off to the races!
Also, for an expert's take on how you can use correlation to build a stronger portfolio, be sure to check out Gatis Roze's "Traders Journal" article at the bottom of this week's newsletter.
Remember, our most powerful features are always reserved exclusively for StockCharts Members. Create more advanced charts, save them to your account, run custom scans and technical alerts, unlock members-only commentary and much, much more! Start your FREE 1-month trial today, and explore all that StockCharts Membership can do for you.
|
|
|
|
|
|
|
by John Murphy
|
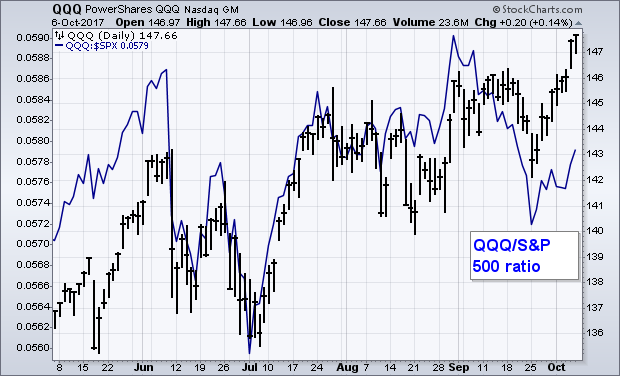 |
Chart 1 shows the Powershares QQQ ETF hitting a record high this week. It was the last of the major stock indexes to do so, and its breakout is a positive sign for the market. It also did slightly better than the rest of the market. The QQQ, however, has still been a relative laggard over the last month. That's shown by the falling QQQ/SPX ratio since the |
|
|
|
|
Bookstore Special
|
 |
|
|
|
by Arthur Hill
|
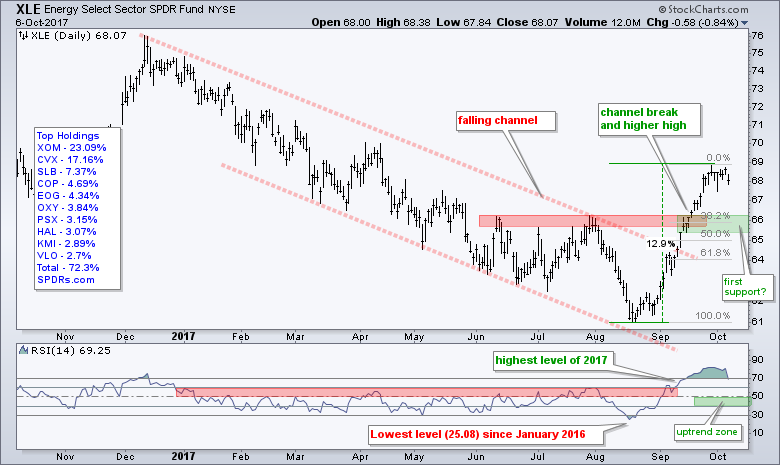 |
The Energy SPDR (XLE) is the top performing sector SPDR since mid August with a double digit advance over the last seven weeks. On the price chart, XLE broke out of the channel, exceeded its summer highs and pushed RSI above 70 for the first time this year. It was a remarkable move, but the ETF is short-term overbought and ripe for a corrective period, which could involve a pullback or a... |
|
|
|
 |
|
|
|
by Greg Schnell
|
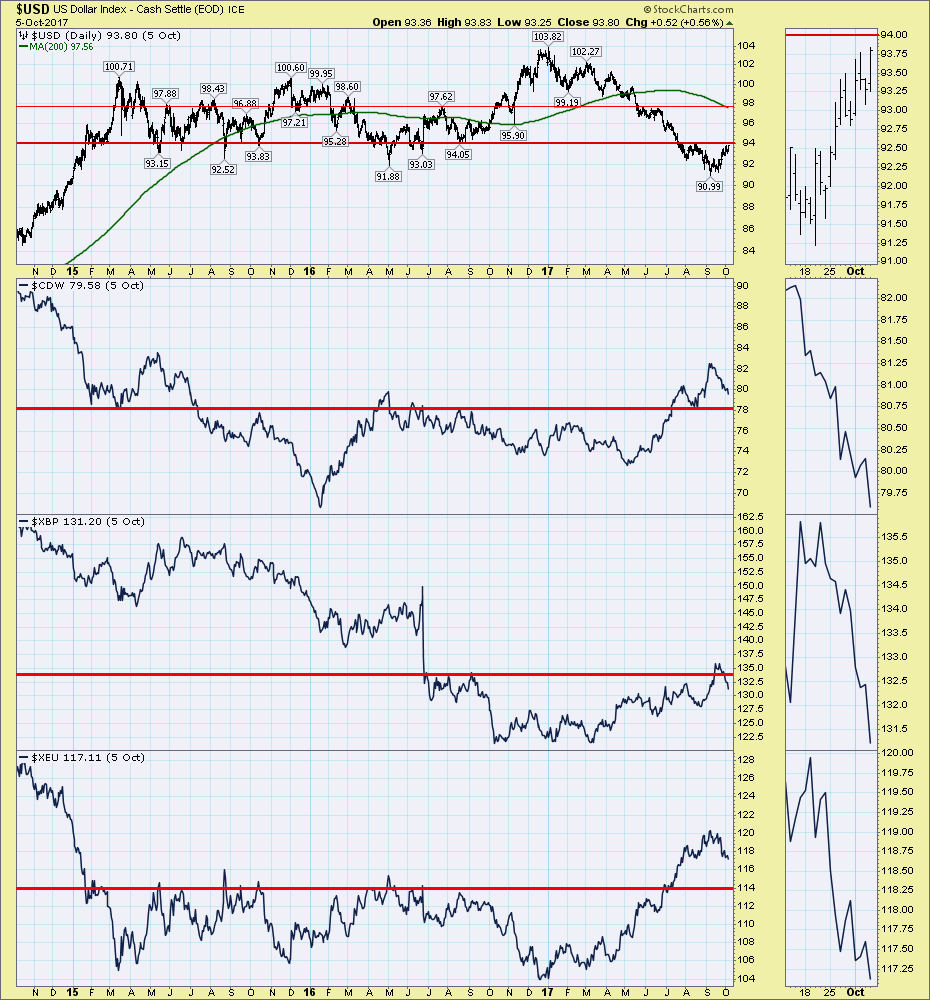 |
This week the US Dollar climbed to its highest level in two months. For those who have been following the Commodities Countdown articles, the reversal in the $USD was expected from the big downtrend. The three-year chart of the $USD shows the Euro turning higher at the start of 2017, the British Pound basing until March and then turning higher and the Canadian Dollar bottoming in May... |
|
|
|
|
|
|
by Tom Bowley
|
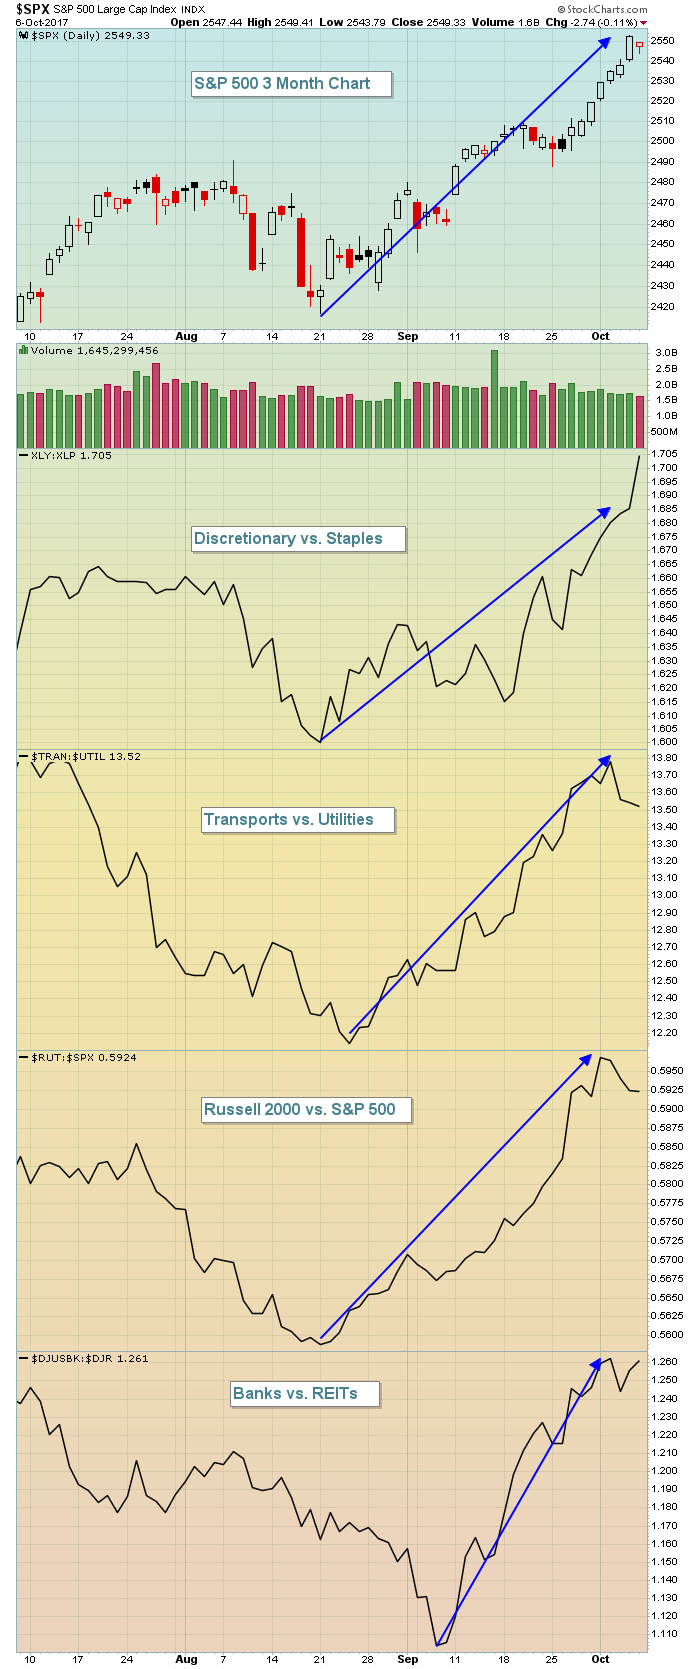 |
I've been following the stock market for a long time and I'm always searching for that perfect signal that never fails. I still haven't found it and there are never any guarantees in the stock market, BUT following the rotation of money to aggressive areas of the stock market can provide fairly reliable confirmation that a bull market rally is sustainable. The four relative ratios... |
|
|
|
|
|
|
by John Hopkins
|
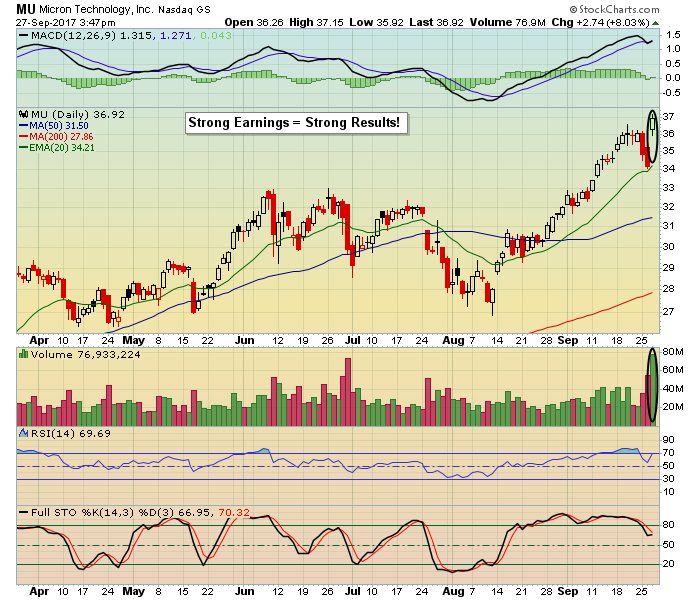 |
They say how time flies; and it's true, especially from one earnings season to another, and starting this week we're going to start hearing from thousands of companies as they release their numbers. And boy, there's nothing traders and longer term investors care about more than earnings. This makes total sense. Think about it. Companies cannot control everything swirling around them. What they... |
|
|
|
|
|
|
by Erin Heim
|
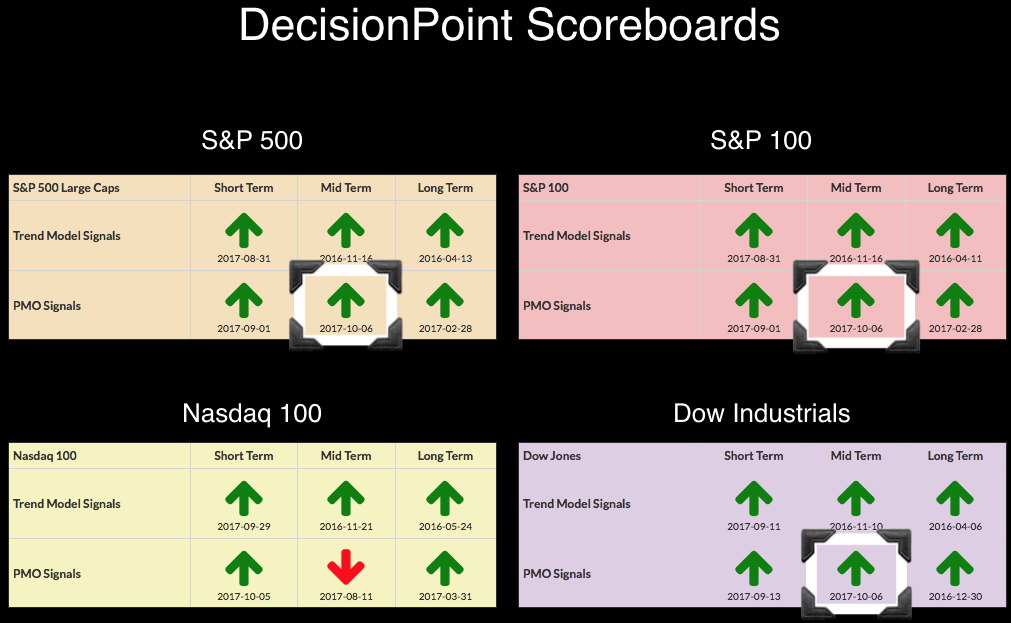 |
Today all but the NDX garnered new PMO BUY signals in the intermediate term. The intermediate-term PMO signals are gathered from the weekly chart PMOs and their crossovers. I'll give you a peek at the NDX weekly chart too, but it is much further away from a new weekly BUY signal. In fact, the NDX weekly chart looks surprisingly bearish. The SPX is in a rising trend channel. Trend lines |
|
|
|
|
|
|
by Gatis Roze
|
 |
Imagine a football coach who has the best eleven quarterbacks in the NFL altogether on the same team and puts them on field at the same time. This "dream team" would get clobbered. Without tight ends, tackles, guards, wide receivers and a center there to present a balanced attack, there would be no hope of victory. So why do so many investors build a team of assets that does precisely the... |
|
|
|
|
|
|
|
|
|
Unlock All of Our
Tools and Features
- + Larger, Full-Screen Chart Sizes
- + Intraday Charts with Real-Time Data
- + Exclusive, Members-Only Commentary
- + Custom Technical Scans and Alerts
|
|
|
|
|
 |
|
|
|
ChartWatchers is our free, twice-monthly newsletter for online investors and StockCharts users. Whether you are brand new to charting or a seasoned analyst, each edition of ChartWatchers brings you insightful, expert commentary from the industry's leading technicians. See what's really happening in the markets through their eyes and gain an edge in your own investing.
|
|
|
|
|
|
| For more information about the ChartWatchers Newsletter or to subscribe for free, Click Here |
This email was sent to [email]. Need the newsletter sent to a different email address?
Simply unsubscribe your current email, then re-subscribe using the new address. |
| Click Here to instantly unsubscribe |