| Hello Fellow ChartWatchers! |
Welcome to the biggest week at StockCharts since, well, 1999. As you may have heard around the site and on StockCharts TV, we've been celebrating our 20th anniversary in a big way these past few days. Special content, featured presentations and guest appearances from John Murphy, Martin Pring, Greg Morris, Gatis Roze, Chip Anderson – the list goes on and on. There was a ton to look back on, but most importantly, a lot to look forward to.
The week culminated with a very special presentation from Chip on MarketWatchers LIVE, where he showed off many of the exciting new features and product developments that our team has been working hard on in 2019.
The biggest among them was a revolutionary new charting tool that we're calling StockChartsACP – "Advanced Charting Platform". It's a wildly dynamic, highly interactive, insanely flexible, ultra-powerful new technical charting tool designed to revolutionize the way you view the financial markets.
We're still putting the finishing touches on the new ACP feature, but we want to give you a sneak peek of what's to come before the full kit launches. To do so, we've released a demo page for you to test out. Visit StockCharts.com/acp-demo to play around with the platform and explore some the exciting capabilities that this new tool will bring.
Now, before you run off to check out the new ACP demo, we have one more big announcement for you...
ChartWatchers is going WEEKLY!
With so many amazing experts on our commentary team, we've simply outgrown our old twice-monthly newsletter format. We're ready to bring some new faces into ChartWatchers and give you even more great content, without having to wait for a full two weeks to get it. So with that, I'll see you back here next Saturday for another edition of ChartWatchers! |
| Until next week, |
|
|
|
| THIS WEEK'S ARTICLES |
| The Market Message |
| Foreign Stocks are Now Rising |
| by John Murphy |
Editor's Note: This article was originally published in John Murphy's Market Message on Thursday, April 4th at 4:16pm ET.
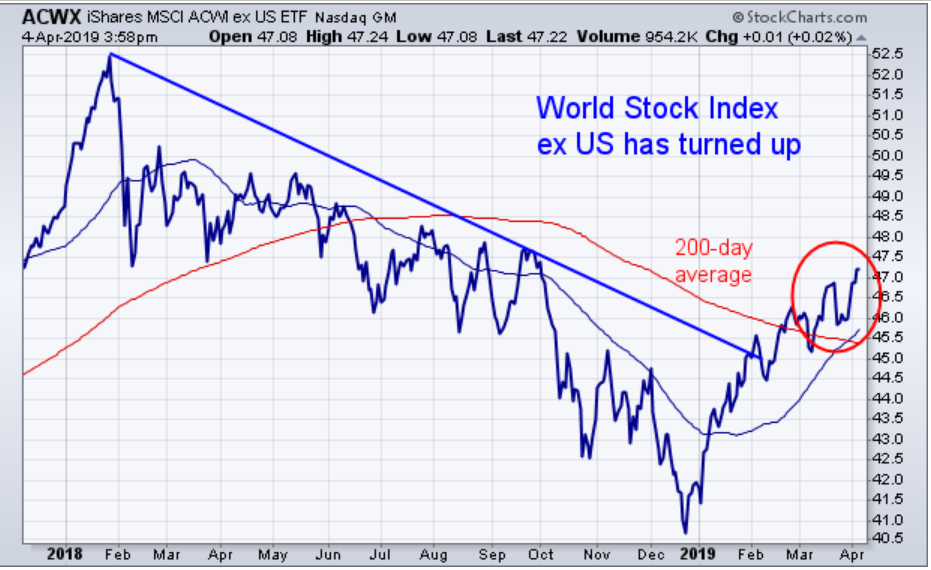
Much of the concerns over the past year have centered around weakness in foreign stocks, and whether that would eventually pull U.S. stocks lower. The general feeling seemed to be that sooner or later the discrepancy between strong U.S. stocks and weak foreign stocks would have to be resolved one way or the other. That meant that U.S. stocks would have to weaken, or foreign stocks would have to strengthen. Right now, it looks like the latter is the case. In other words, foreign stocks have started rising again which is helping support the 2019 rally in U.S. stocks. The solid blue line in Chart 1 shows the MSCI All Country World Index Ex US iShares (ACWX) rising to the highest level in six months. In so doing, the ACWX has also risen above a falling trendline drawn over the highs formed since last February. That signals that the nearly yearlong decline in foreign stocks has probably ended. The ACWX has risen back over its 200-day average for the first time in ten months; and its blue 50-day line has crossed over the 200-day line. All are bullish signs that suggest that foreign stocks are heading higher. The global rally is being supported by rising stocks in foreign developed and emerging markets. One of the most encouraging signs is coming from new signs of global leadership by mainland Chinese stocks which are rising even faster than U.S. stocks.
Chart 1
|
| READ ONLINE → |
|
|
|
| Art's Charts |
| RSI Shifts from Bearish to Bullish for EEM |
| by Arthur Hill |
 The Emerging Markets ETF (EEM) experienced a trend-momentum shift over the last few months as RSI moved from its bear range to its bull range. In addition, RSI came close to 70 (69.5) twice and EEM broke above its 200-day SMA. The downtrend reversed and I expect higher prices until the evidence proves otherwise. The Emerging Markets ETF (EEM) experienced a trend-momentum shift over the last few months as RSI moved from its bear range to its bull range. In addition, RSI came close to 70 (69.5) twice and EEM broke above its 200-day SMA. The downtrend reversed and I expect higher prices until the evidence proves otherwise.
The chart below shows EEM falling into October 2018 and then firming in the last two months of the year. EEM actually showed some relative strength from October to December because it forged a higher low when SPY forged a lower low. This is partly due to strength in China because Chinese stocks account for a third of the ETF. EEM went on to break resistance at the November-December highs and moved above its 200-day SMA. Most recently, the ETF consolidated above the 200-day and broke out of this consolidation this week. Price action is clearly bullish.
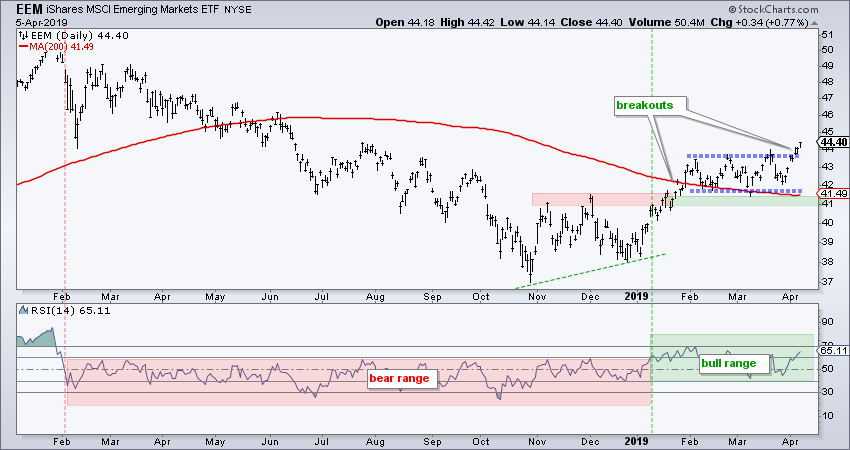
The indicator window shows RSI moving from a bear range to a bull range in January. Notice how RSI traded between 20 and 60 from February 2018 to January 2019. RSI broke above 60 in January and has since held above 40. This puts RSI in its bull range (40 to 80) and suggests that the trend-momentum cup is half full.
White Paper and On Trend Next Week
Want to know more about using RSI for trend-momentum strategies? On Trend will feature a two part series on using RSI to define trend consistency and persistency. These videos will breakdown RSI and then show how it can be used to find stocks with the strongest uptrends. There is also a link to a white paper below.
RSI for Trend Following and Momentum (Part 1)
Tuesday, April 9 at 10:30 AM on StockCharts TV
Testing RSI Range-Momentum Signals (Part 2)
Thursday, April 11 at 10:30AM on StockCharts TV
Recordings will also be posted on our Youtube channel.
This two-part series is based on a detailed research paper I wrote at the end of 2018. You can download this paper here on dropbox.
- Arthur Hill, CMT
Senior Technical Analyst, StockCharts.com
Book: Define the Trend and Trade the Trend
Twitter: Follow @ArthurHill
|
| READ ONLINE → |
|
|
|
 |
| The Canadian Technician |
| Can Autos Accelerate Without Tesla? |
| by Greg Schnell |
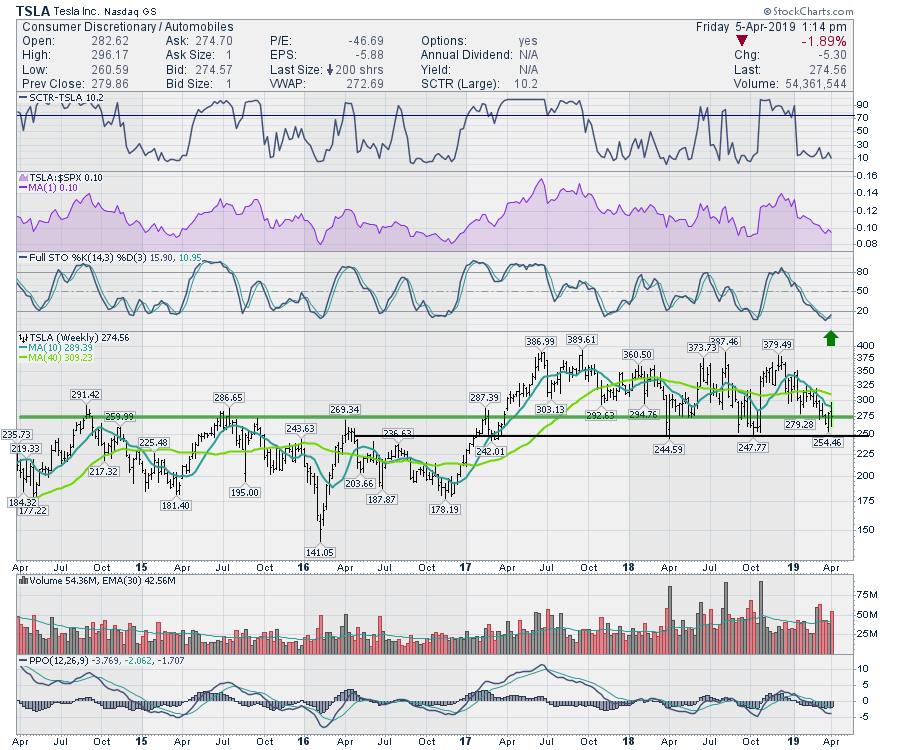
The auto charts are a mixed bag. For the last few years, they have had trouble outperforming; even Tesla (TSLA) has been dead money for buy-and-holders. However, it's starting to look like the broader group wants to start running; below are a few charts of interest.
Tesla sits at the low end of the multi-year range. While the Tesla chart is definitely the most volatile automaker, it does not mean that the rest of the group can't go higher. If Tesla is going to keep bouncing off the lows, that is definitely bullish.
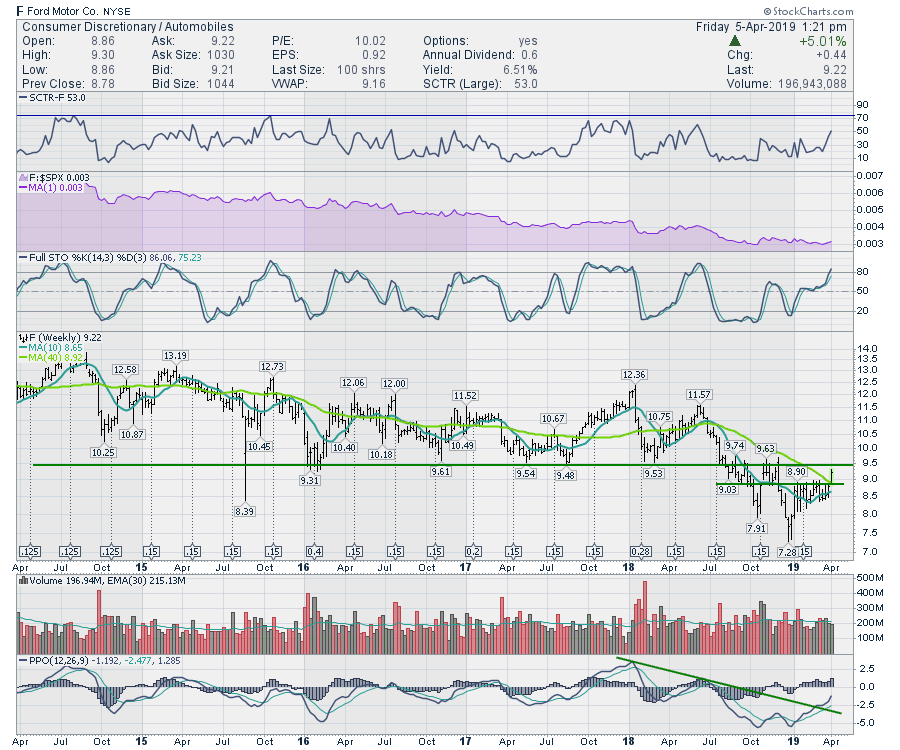
 We also had a nice 3-month high on Ford (F). Ford has a lot of resistance overhead at $9.50, which was a major level of support back in the 2014-2017 time period. "Support becomes resistance" once support is broken - that is one of the key premises of technical analysis. If Ford can move and stay above this long-term level, that will be quite an accomplishment. We also had a nice 3-month high on Ford (F). Ford has a lot of resistance overhead at $9.50, which was a major level of support back in the 2014-2017 time period. "Support becomes resistance" once support is broken - that is one of the key premises of technical analysis. If Ford can move and stay above this long-term level, that will be quite an accomplishment.
The SCTR is a ranking method for stocks that compares the price action of a stock with the price action of other stocks within a group. In this case, the group is large-cap stocks. When a stock outperforms the rest of the market, that can be a good way to locate leadership; an indicator's up move demonstrates the stock's ability to perform as a leader. The SCTR ranking for Ford has never made it into the top 25% at any point in the last five years, which would be above the blue line on the indicator; thus, Ford has not been a leader for a long period of time.
If we look at the SCTR indicator on the Tesla chart above, you can see when the Tesla price action outperformed by looking at the SCTR. The bottom line is that it would be a remarkable achievement for Ford to start outperforming from this breakout.
 While all the charts in the auto sector are trying to break through downtrends or sideways trading ranges, it would be a major move if they start to break out as an industry. GM has one of the stronger charts in the group, but it is still in a trading range. The PPO indicator looks like it is trying to turn up while above zero, marking this as a critical place on the chart. Usually, this is a very bullish place to jump on the trend with a close stop. While all the charts in the auto sector are trying to break through downtrends or sideways trading ranges, it would be a major move if they start to break out as an industry. GM has one of the stronger charts in the group, but it is still in a trading range. The PPO indicator looks like it is trying to turn up while above zero, marking this as a critical place on the chart. Usually, this is a very bullish place to jump on the trend with a close stop.
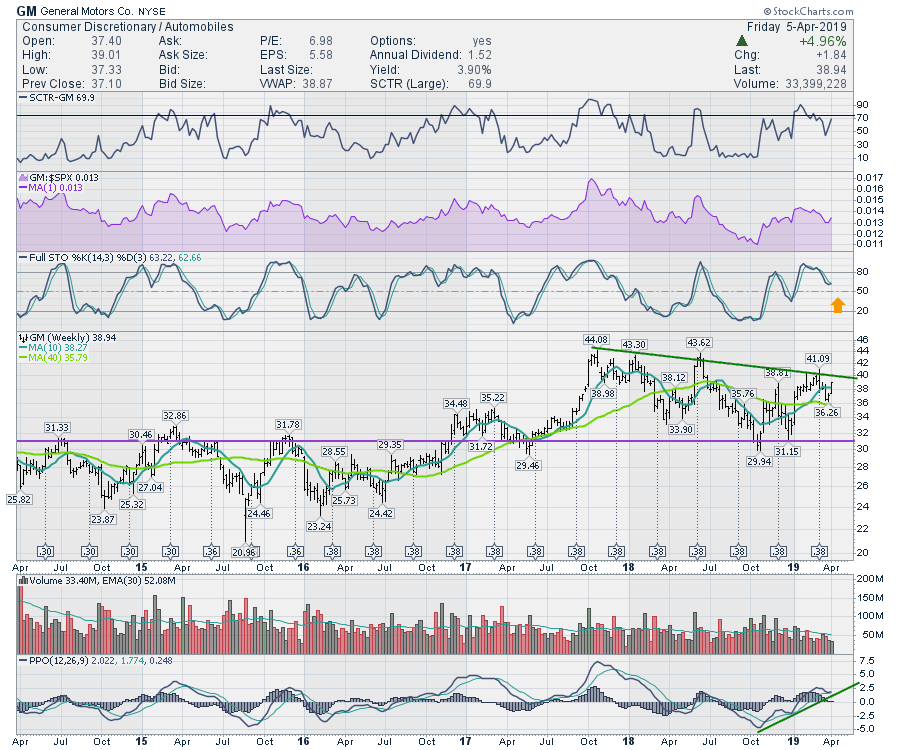 There are other charts setting up nicely in the group. Toyota, Tata Motors and Honda all are trying to set up with the PPO momentum indicator turning higher. I am also starting to notice car part manufacturers turning up as well. If the Yen drops, that could help Toyota and Honda outperform as well. There are other charts setting up nicely in the group. Toyota, Tata Motors and Honda all are trying to set up with the PPO momentum indicator turning higher. I am also starting to notice car part manufacturers turning up as well. If the Yen drops, that could help Toyota and Honda outperform as well.
The bottom line is that it looks like the car companies are getting ready to surge. In an environment where the whole industry is trying to push higher, that can be very supportive for higher prices.
Good trading,
Greg Schnell, CMT, MFTA
|
| READ ONLINE → |
|
|
|
| Earnings Beats |
| Earnings Season Can Produce Real Sizzle |
| by John Hopkins |
As earnings season gets ready to kick off this week once JPM, PNC and WFC report their results on Friday, here's a reminder that those stocks that come up big on the top and bottom line could ultimately become high reward-to-risk trading candidates, possibly multiple times. There are many examples of this from last quarter, but one stock that stands out as worthy of examining is Trade Desk (TTD).
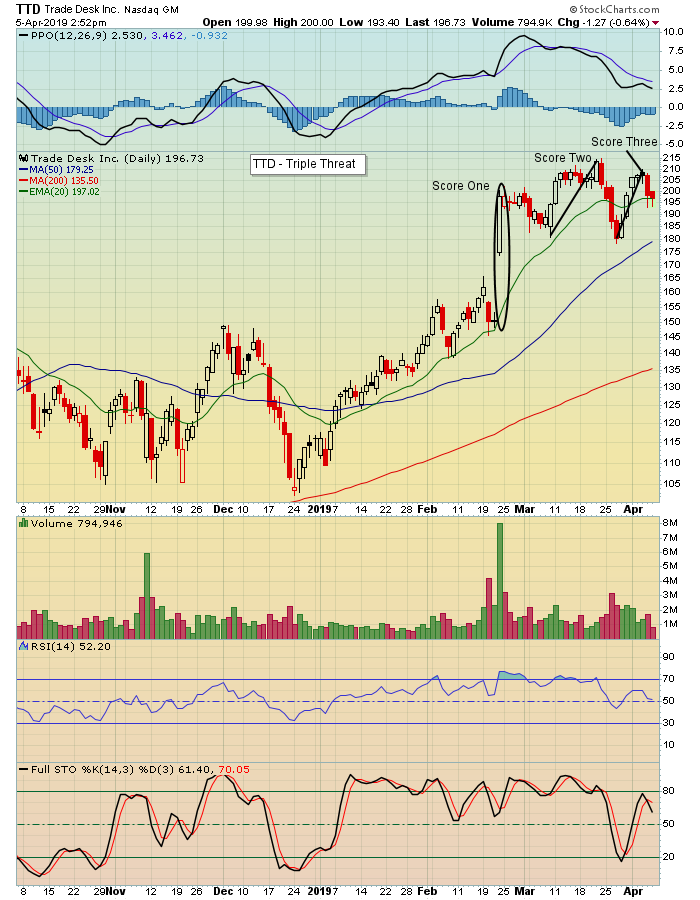
Starting with the initial boost from its earnings report, TTD rose over 30% after posting its numbers, then almost 19% when it pulled back to test its 20-day moving average, then over 17% after it pulled back to retest that same level three weeks later. So there, over the course of just over a month, were several opportunities to score sizable gains in a single stock.
Another stock that provided multiple gain opportunities is Apple (AAPL), which had an initial boost of 13.5% within a few days of posting earnings (almost 17% after a test of its 20-day) and another 6.7% gain following a test of its 200-day (after it had broken through that key technical level a few days earlier).
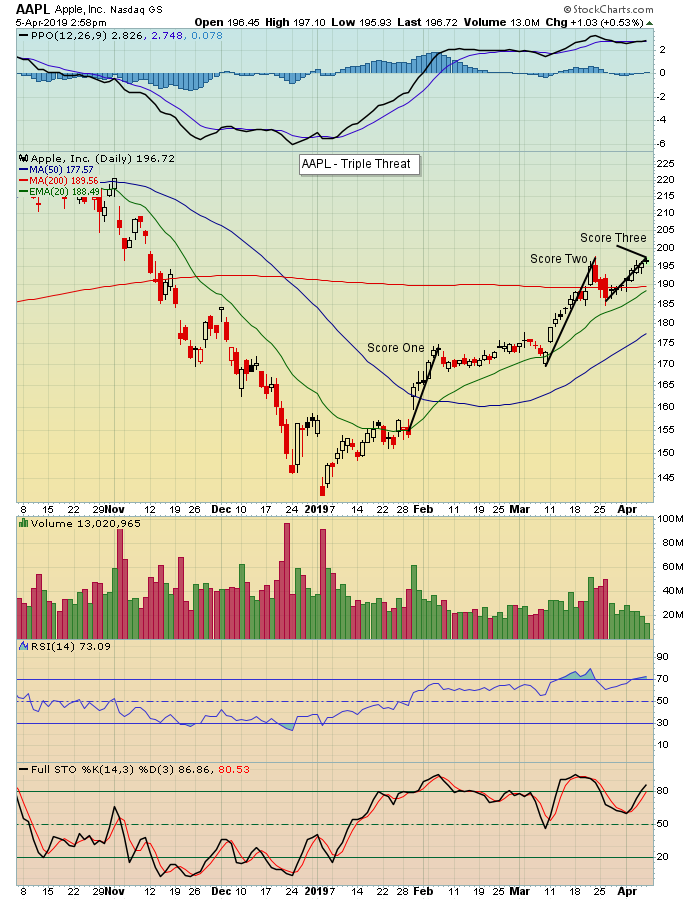
I'm pointing out these two examples to show the power associated with identifying and tracking those stocks that beat expectations, as well as how you can profit even after a gap up after earnings, especially if you are patient; traders love to be attached to winners.
As earnings season kicks into high gear over the next number of weeks and as thousands of companies report their results, we're going to be scanning for those companies that outshine expectations. We'll be adding them to our Strong Earnings ChartList, including key entry and exit levels. Later, we'll be revisiting them in the weeks ahead after they pull back to levels that could provide solid gains. If you would like to learn how you can get access to our list, just click here.
The market is hot at the moment and could continue to rise, though we could see a decent pullback as the market gets stretched. Whatever the case, it makes a lot of sense to turn your attention to the "best of the best," i.e. those stocks that can stand up in any type of market environment.
At your service,
John Hopkins
EarningsBeats
|
| READ ONLINE → |
|
|
|
|
|
| The Traders Journal |
| Video Recap: My Favorite Investment Tools, Tricks and Tips on StockCharts |
| by Gatis Roze |

As I announced last week, I had the pleasure of joining Tom and Erin on Wednesday morning for a special StockCharts TV guest appearance. It was a treat to be on the program, but most importantly, it was a unique joy to help celebrate StockCharts' 20th anniversary.
As a follow-up and in case you missed the live show, I’d like to invite you to watch this short video recap from my appearance on the StockCharts TV channel. In it, I share some of my absolute favorite tools, tricks and tips that have helped me achieve excellent returns over the past two decades. I firmly believe that these insights will help you strengthen your own analysis and maximize your returns.
Trade well; trade with discipline!
- Gatis Roze, MBA, CMT
StockMarketMastery.com
|
| READ ONLINE → |
|
|
|
| DecisionPoint |
| Materials Sector (XLB) Bursts Through Resistance with Confirming LT Buy Signal |
| by Erin Swenlin |
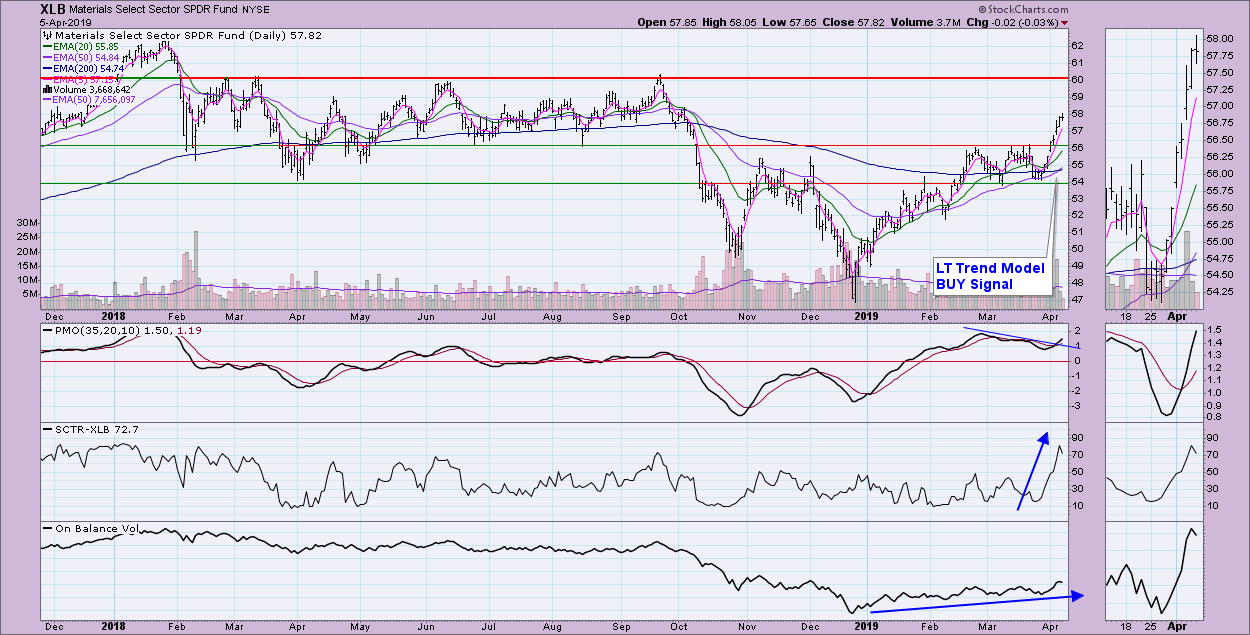
While I maintain the DecisionPoint Scoreboard for the large-cap SPX, OEX, NDX and Dow, Carl maintains a DecisionPoint "Sector" Scoreboard. On Friday's DecisionPoint show (which airs Fridays at 4:30p EST on StockCharts TV), Carl and I pointed out that the Materials sector triggered a new LT Trend Model BUY signal. Interestingly, the signal came on the heels of a significant breakout. The only two sectors left with SELL signals are XLE and XLF, which have both been reluctant to accelerate off of December lows at the same rate as many of the other sectors.
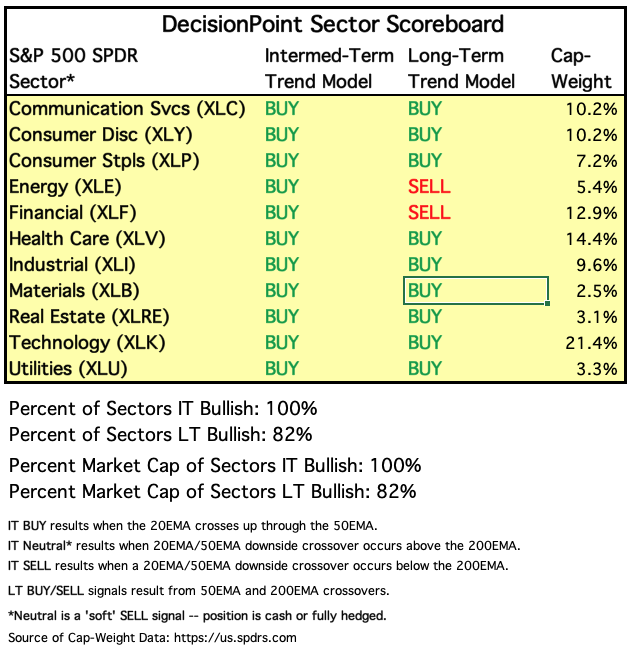
A Long-Term Trend Model BUY signal is generated when the 50-EMA crosses above the 200-EMA. XLB had been traveling in a consolidation zone since about mid-February. On Monday, price broke above overhead resistance. On Tuesday, the Price Momentum Oscillator (PMO) triggered a BUY signal with a positive cross over its signal line. The week continued strong for XLB, as the PMO moved out of a declining trend and the SCTR shot upwards. The OBV is confirming the rising trend. It looks like $60 is the next area of overhead resistance.
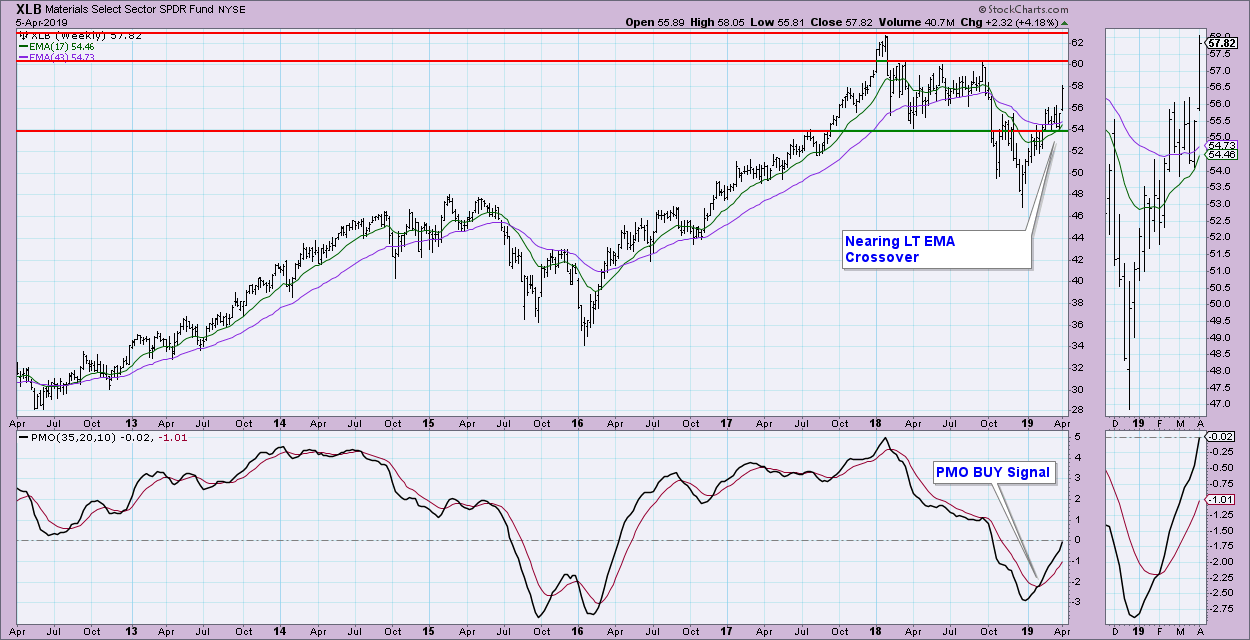
On the weekly chart, we can see another PMO BUY signal. Our Trend Models aren't based on weekly chart crossovers, but I do see that the 17-week EMA is about to cross above the 43-week EMA. The weekly chart confirms overhead resistance at $60, but it also suggests that the price could rise higher and test the overhead resistance at $63.
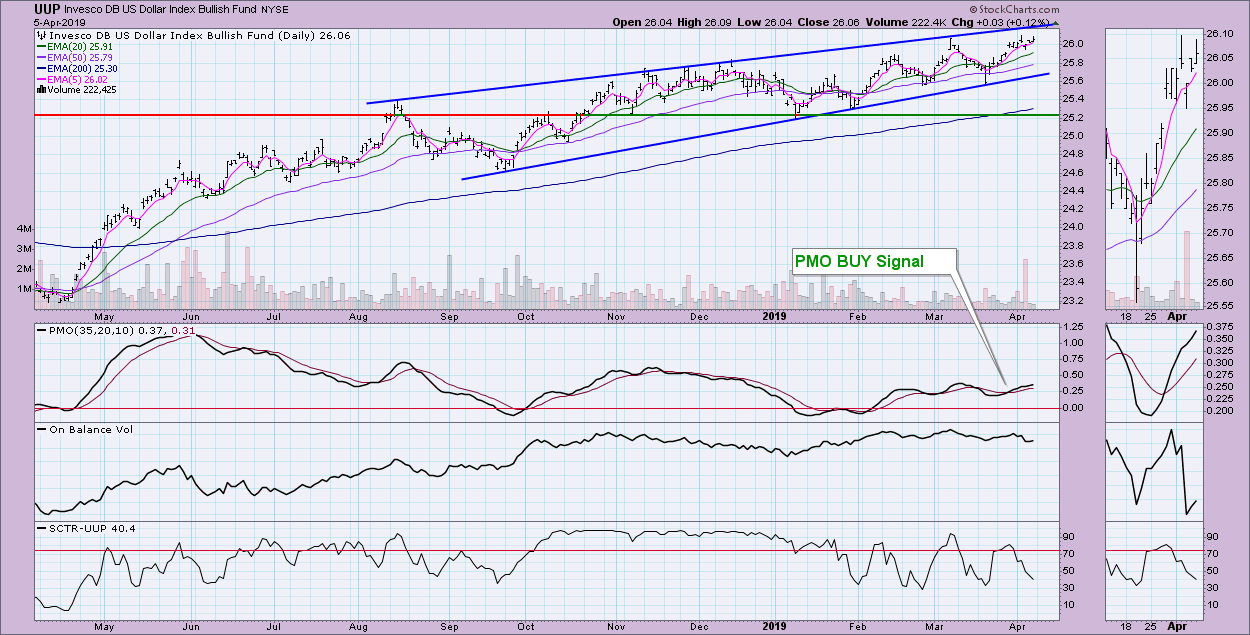
Conclusion: The Dollar is possibly weakening near the top of an ascending wedge. However, it is a loose long-term pattern that may not resolve this time around either. The last price top didn't make it up to the top of the wedge, which could suggest a decline. A weak Dollar would likely help the Materials sector and feed its current rally.
Watch the latest episode of DecisionPoint with Carl & Erin Swenlin LIVE on Fridays 4:30p EST or on the StockCharts TV YouTube channel here!
Technical Analysis is a windsock, not a crystal ball.
Happy Charting!
- Erin
Helpful DecisionPoint Links:
Erin's PMO Scan
DecisionPoint Chart Gallery
Trend Models
Price Momentum Oscillator (PMO)
On Balance Volume
Swenlin Trading Oscillators (STO-B and STO-V)
ITBM and ITVM
SCTR Ranking
**Don't miss DecisionPoint Commentary! Add your email below to be notified of new updates"**
|
| READ ONLINE → |
|
|
|
| MORE ARTICLES → |
|


 The Emerging Markets ETF (EEM) experienced a trend-momentum shift over the last few months as RSI moved from its bear range to its bull range. In addition, RSI came close to 70 (69.5) twice and EEM broke above its 200-day SMA. The downtrend reversed and I expect higher prices until the evidence proves otherwise.


