|
|
| Hey There Fellow ChartWatchers |
Putting on a new trade is easy. The hard part is following that trade, monitoring that position and sticking to your system. Especially in a fast-paced market like we have here today, staying on top of your open trades is positively crucial.
So on this week's edition of "StockCharts In Focus", we're showing you how to track entry points, stop levels and price targets directly on your charts. This is one from my very own toolkit, so I'll explain how I use this exact chart setup trick to follow my own trades all the way from potential target to active position.
Putting those key price levels front and center on your screen not only enhances your position management, but also saves you time. Instead of sifting through your notes to see where you set that stop or logging into your brokerage account to remember what price you got in at, all you'll have to do is check the chart.
Knowing the value of solid monitoring routines, these are some of the tools I simply refuse to trade and invest without - and I'd argue that you shouldn't either!
Click the thumbnail below to watch now.
 |
| Chart on, my friends. |
| Grayson Roze |
VP of Operations, StockCharts.com
Author, Trading For Dummies
Author, Tensile Trading |
  |
|
|
| THIS WEEK'S ARTICLES |
|
|
|
|
|
|
|
|
|
|
| The Canadian Technician |
| Is This Market Resilient or What? |
| by Greg Schnell |
| Have you ever stood at the edge of the Grand Canyon and wondered about all the history of each cave or ridge? What about the multiple valleys that ultimately drain to the Colorado River? It is a daunting site to behold, but, as the winds blow past you and the hawks soar overhead,... |
|
|
|
|
|
|
|
|
|
| Top Advisors Corner |
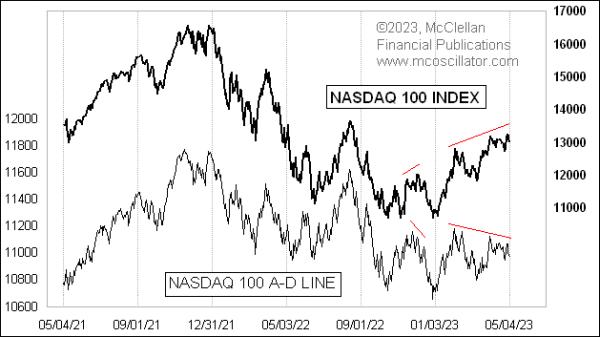
| Nasdaq 100 A-D Line Divergence |
| by Tom McClellan |
| Last week, I addressed the divergence that was evident between the share price of QQQ and its equal-weighted cousin, QQEW. Both of those ETFs are designed to track the stocks in the Nasdaq 100 Index (NDX)... |
|
|
|
|
|
| MORE ARTICLES → |
|
|
|
| Stocks Power Higher Driven By AAPL, Energy | Dave Keller, CMT | (05.05.23) |
|
|
|
|
|
| 5 Uptrends At The Top of My List | Larry Tentarelli | Your Daily Five (05.05.23) |
|
|
|
|
|
| Communication Services Over Financials | David Keller, CMT | The Final Bar (05.02.23) |
|
|
|
|
|
| Market Whimpers Into Close After Fed | David Keller, CMT | The Final Bar (05.03.23) |
|
|
|
|
|
| VIX Rises Above 20 as Banks Falter | David Keller, CMT | The Final Bar (05.04.23) |
|
|
|
|
|
| Quit Trading Without This! Track Entries & Stops On The Chart | Grayson Roze | StockCharts In Focus |
|
|
|
|
|
| UPCOMING GUESTS |
|
|
| WATCH LIVE → |
|
 |
| Smarter Investing Starts Here. |
| As a StockCharts Member, you unlock all of our most powerful tools and features, including saved charts and settings, custom scans, technical alerts and much more. Discover all that StockCharts can do with our free 1-month trial and start charting like a true market pro. |
|
|
| Learn More |
|
|
| ChartSchool "Tip of the Week" |
| With the three indicators included in our Relative Volume plug-in for StockChartsACP, you can easily pinpoint high or low volume moves for the securities you're watching. The indicators display volume data relative to a customizable average of your choosing in different visual orientations. You can even adjust the baseline to easily zero in on more extreme volume moves. |
|
| VISIT CHARTSCHOOL → |
|
|
|


