- Charts Worth Watching: aa, aci, atmi, csco, DIA, fic, intc,
IWM, jpm, ma, plcm, pmtc, QQQQ, shlm, smh, SPY, v, xlb, xlf
- Link to today's video (click here).
- The next update will be Friday (June 5) around 9 AM ET.
*****************************************************************
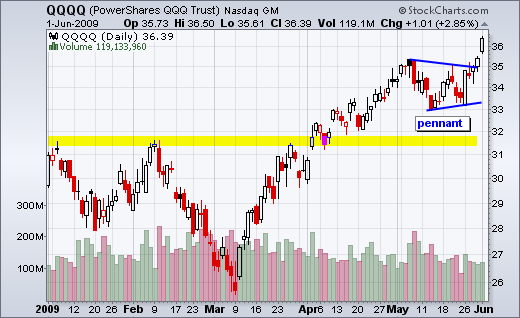
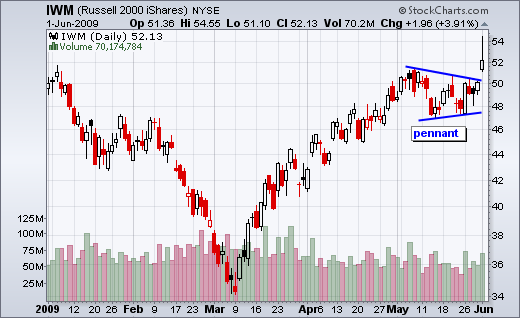
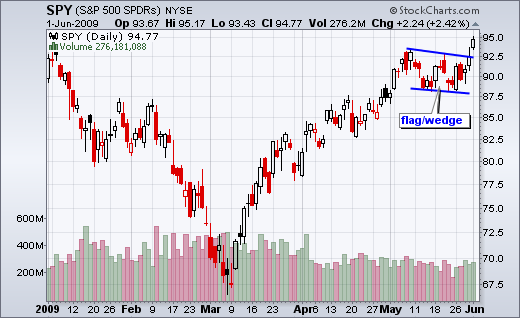
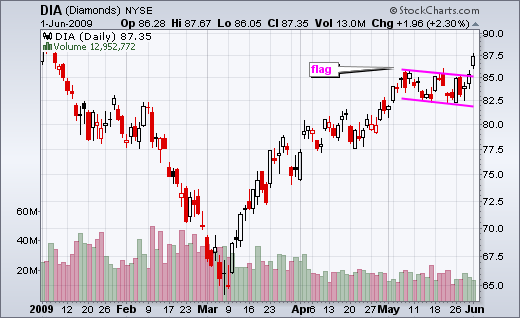
After pointing out bullish consolidations in the major index ETFs on Friday morning, we saw breakouts as stocks surged on Friday and Monday. It is hard to argue with breakouts across the board. They should be considered bullish until proven otherwise. DIA broke flag resistance, QQQQ broke pennant resistance, SPY broke flag/wedge resistance and IWM broke pennant resistance. QQQQ broke resistance first with a strong close on Friday. DIA, SPY and IWM followed suit on Monday with gaps and breakouts. These gaps and breakouts are bullish as long as they hold. A move back below Friday's close would fill these gaps and call for a reassessment. With the surge over the last five days, the late May lows become the medium-term support levels to watch for signs of trend change.
*****************************************************************
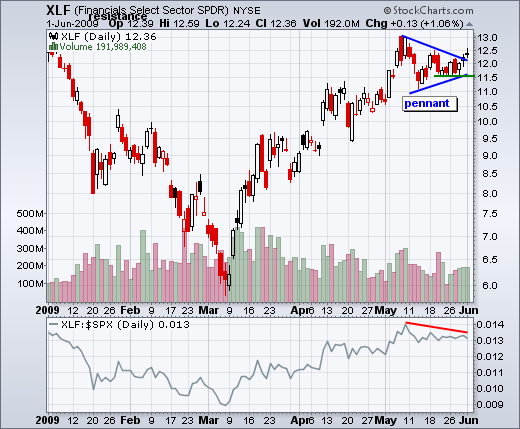
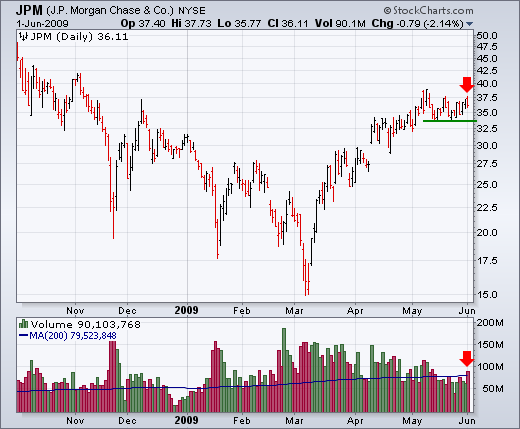
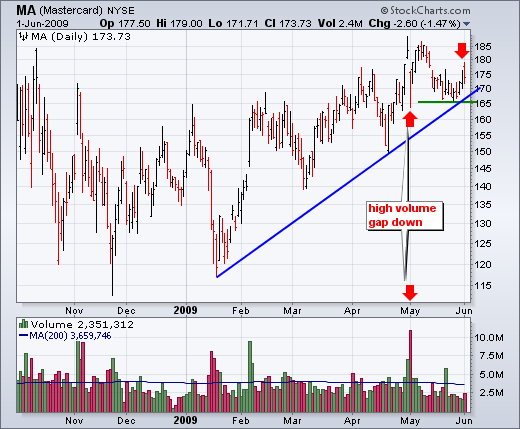
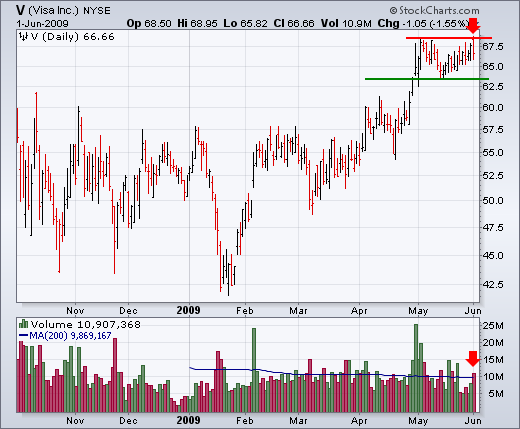
Despite a big move in the major index ETFs on Monday, the Financials SPDR (XLF) gained just over 1% and lagged the broader market. With SPY up 2.42% on Monday, I would expect an equivalent or greater gain from this key sector. On the price chart, XLF advanced the last three days and broke pennant resistance, but an indecisive doji formed on Monday. This candlestick shows that XLF closed near its open. Put another way, there was little change from open to close. Buyers did not keep up the pressure after the strong open. The ETF established support around 11.5 in late May and this is the level to watch for signs of weakness. Within the sector, JP Morgan (JPM) actually closed down on Monday with above average volume. Watch support from the late May lows for a potential break down. Mastercard (MA) also closed down on Monday. Watch for a break below support at 165 to reverse the 2009 uptrend. Visa (V) met resistance from its early May high and closed lower on Monday. Watch support from the mid May low for signs of a reversal.
*****************************************************************
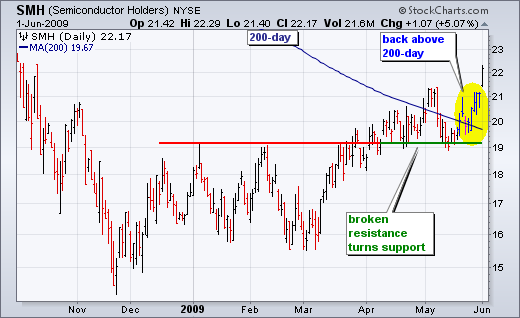
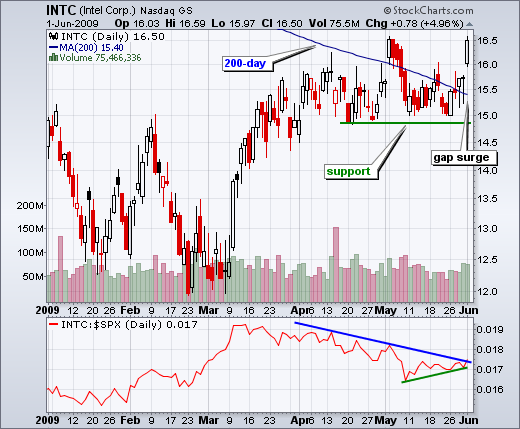
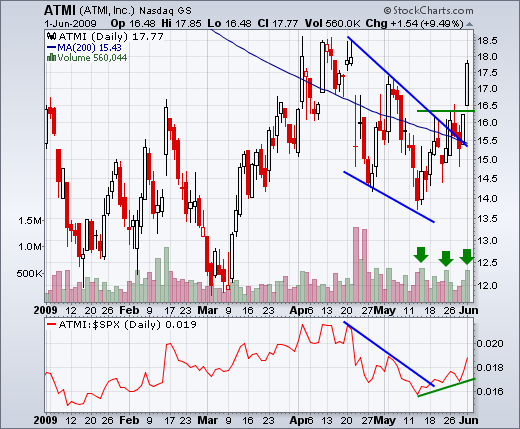
Semiconductors showed relative strength with a 5.07% gain on Monday. Leadership from chips is positive for the tech-heavy Nasdaq and the market overall. On the price chart, the Semiconductors HOLDRS (SMH) broke resistance around 19 in late March and early April. Broken resistance turned into support as SMH bounced off 19 in late April and mid May. With the surge over the last five days, SMH reinforced support and broke back above the 200-day moving average. Intel (INTC) is the biggest component of the Semiconductors HOLDRS. The stock held support at 15 last week and surged back above its 200-day moving average as well. ATMI Inc (ATMI) broke wedge resistance with a high volume surge on Monday.
*****************************************************************
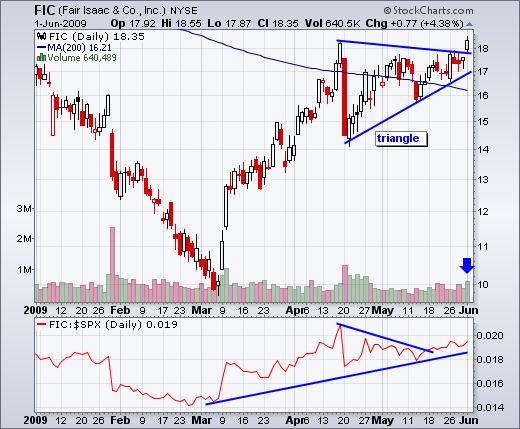
The next four charts show more breakouts within the technology sector. After plunging in mid April, Fair Isaac (FIC) worked its way back to resistance and broke above 18 with above average volume on Monday.
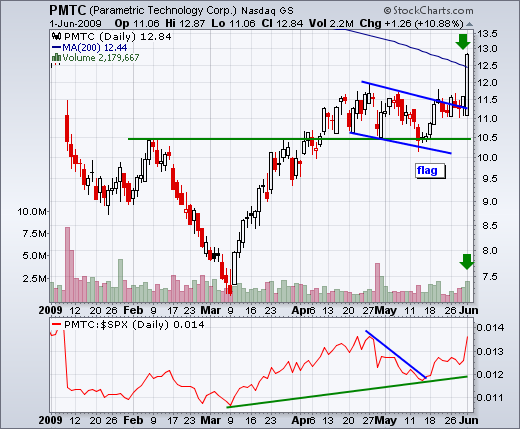
Parametric Technology (PMTC) formed a falling flag in April-May and successfully tested support from broken resistance in the process. The stock surged off support in mid May and then broke resistance with a huge move on Monday. Also notice that volume increased and the price relative turned sharply higher.
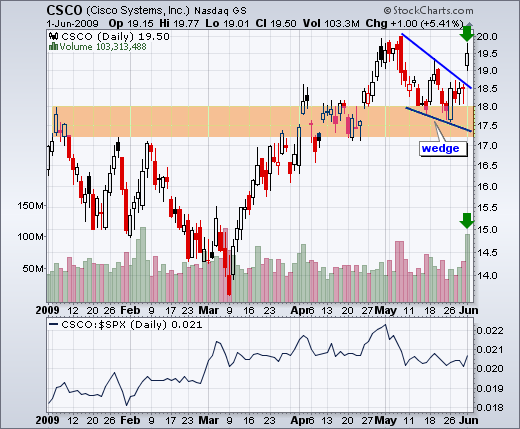
Cisco (CSCO) found support from its broken resistance zone around 17.5. The stock formed a falling wedge in May and broke wedge resistance with a high volume surge in June. The gap and breakout are bullish as long as they hold.
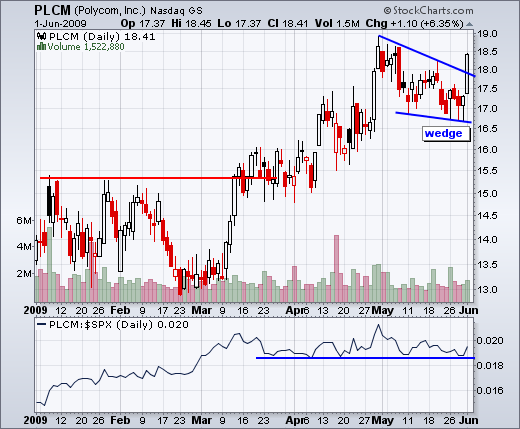
Polycom (PLCM) corrected with a falling wedge in May and then broke resistance with a big surge the first day of June. This move reinforces support from the May lows and signals a continuation of the spring advance.
*****************************************************************
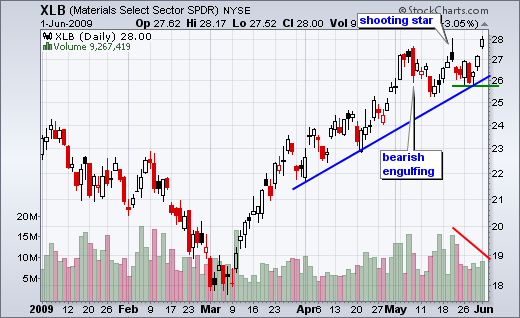
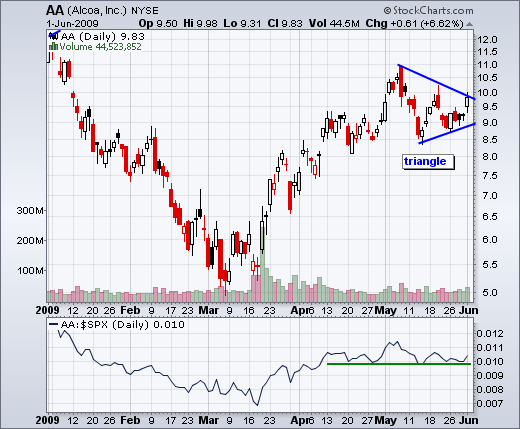
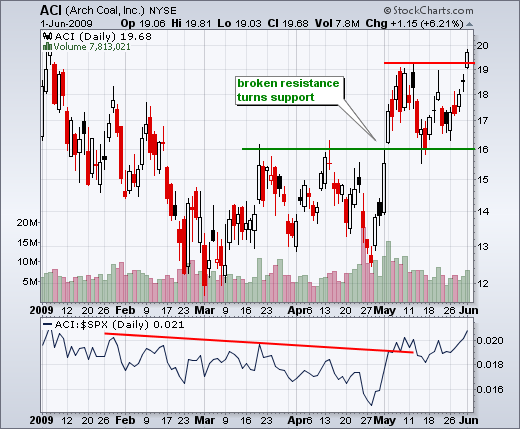
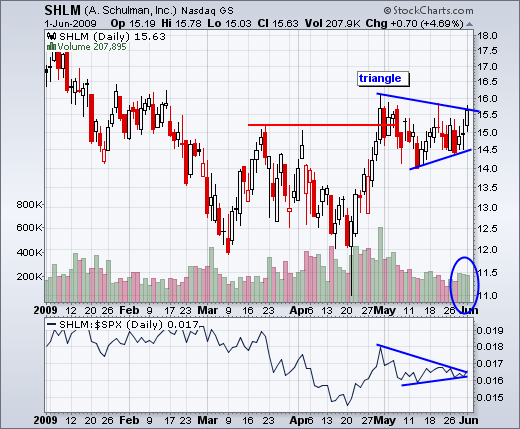
The Materials SPDR (XLB) surged to a new high for the year on Monday. I thought XLB was topping after the bearish engulfing in early May, shooting star on May 20th and gap down on May 21st. With the surge over the last three days, it looks like the bulls have a little more energy left. Volume on this latest surge was below the levels seen in May though. Nevertheless, a higher low formed last week and this level marks the first support level to watch. Within the sector, Alcoa (AA) bounced off triangle support with pretty good volume. Follow through above 10 would break triangle resistance. Arch Coal (ACI) found support from broken resistance in May and surged above 19 on Monday. A. Schulman (SHLM) broke above its March highs in late April and then formed a triangle in May. The stock moved to triangle resistance with three good volume days. Follow though would break triangle resistance.
*****************************************************************

