- Charts Worth Watching: AET, CAT, DE, DIA, EMC, IMKTA, IR, IWM, JPM, LLY, OCR, QQQQ, SNPS, SPY, TTWO, TXT, WFC, XLF, XLI
- Link to today's video (click here).
- The next update will be Tuesday (June 9) by 9AM ET.
*****************************************************************
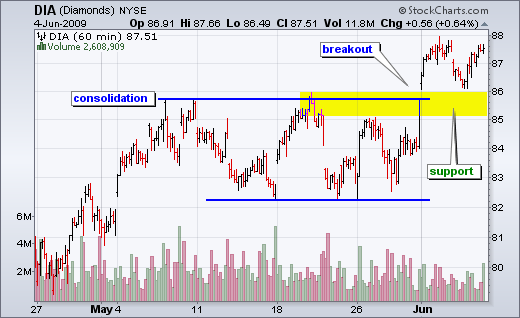
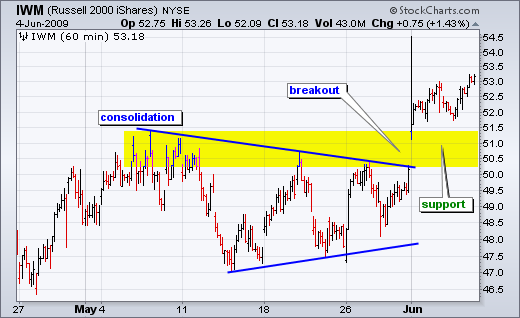
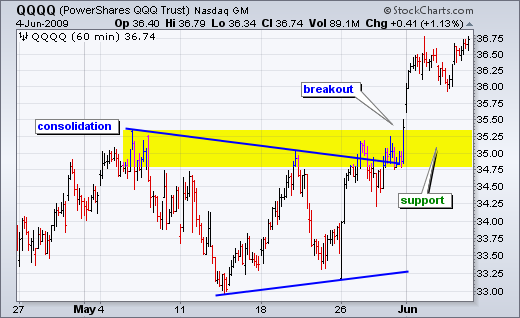
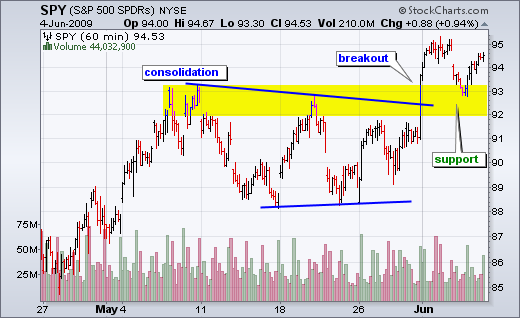
Even though the major index ETFs are still overbought medium-term, recent breakouts are short-term bullish and these breakouts are holding. With the medium-term trend clearly up, we should treat these breakouts as bullish until proven otherwise. The first four charts cover the major index ETFs (DIA, IWM, QQQQ and SPY). I am showing 60-minute charts to focus on the recent breakouts. All three charts feature a consolidation, a breakout and a support zone (yellow area). A strong breakout should hold. Failure to hold this breakout and a move below the yellow support zone would be short-term bearish. As far as the medium-term uptrend is concerned, the May lows mark key support and it would take a break below these levels to reverse the uptrend.
*****************************************************************
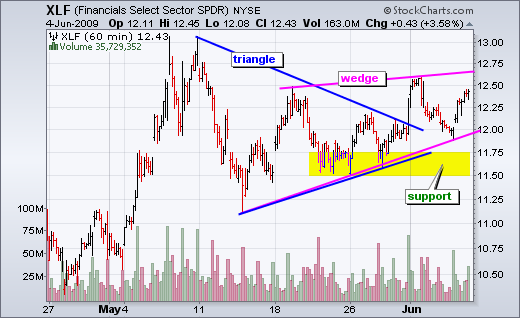
The analysis process is often a balancing act between what is happening and what will happen. Everyone, of course, wants to know what WILL happen to better position themselves. However, we cannot ignore what IS happening. The chart for the Financials SPDR (XLF) is a case in point. What IS happening here? The ETF broke triangle resistance and is moving higher. In Dow Theory terms, this breakout is bullish until proven otherwise. As far as I am concerned, prices will continue to rise until this pattern is negated. The pink lines show a rising wedge that defines the current uptrend. Rising wedges are bearish patterns that represent a corrective advance that retraces a portion of the prior decline. The bulls have the edge as long as the wedge rises because the trend is up. A break below the lower trendline and a move below the yellow support zone would reverse this uptrend. I would then expect XLF to move lower over the coming days, perhaps weeks.
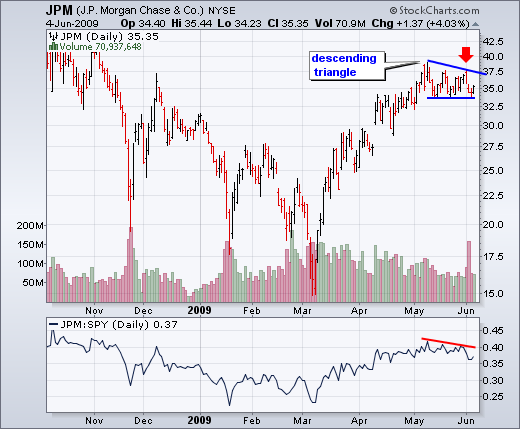
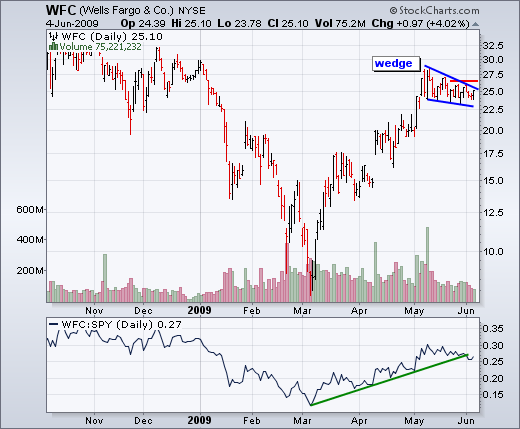
For clues on XLF, we should watch JP Morgan (JPM) and Wells Fargo (WFC), which are the two biggest components and make up over 22% of the ETF. JPM formed a small descending triangle over the last few weeks. The stock declined on high volume earlier this week and a support break would be short-term bearish.
WFC formed a small falling wedge that looks like a correction. The short-term trend is down as long as the wedge falls. Look for a break above wedge resistance to reassert the bigger uptrend.
*****************************************************************
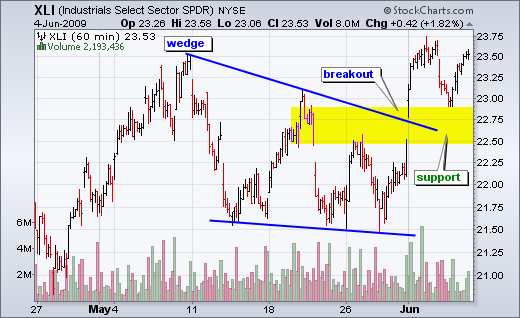
The Industrials SPDR (XLI) is showing some relative strength with a breakout and successful support test over the last few days. XLI formed a falling wedge in May and broke wedge resistance with a surge on Monday. Broken resistance turned into support and the yellow area marks a support zone. With the first support test successful, the breakout is holding and remains bullish. A move below the support zone would negate the breakout and call for a reassessment.
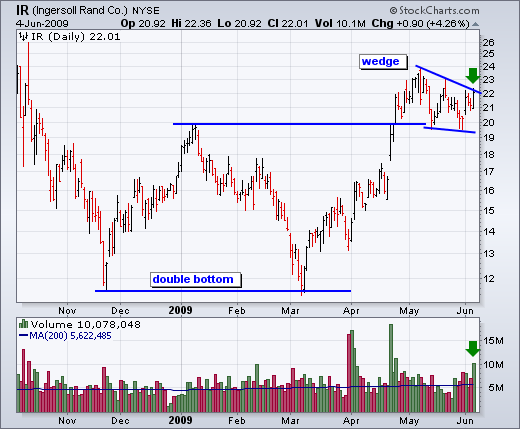
Within the group, Ingersol Rand (IR) broke double bottom resistance in April and then consolidated with a falling wedge. With a high volume surge this week, the stock is challenging wedge resistance.
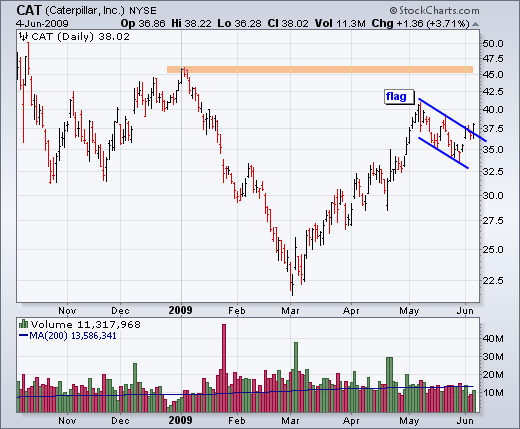
Caterpillar (CAT) formed a falling flag in May and broke resistance with a surge above 37.5 on Thursday. Volume could have been higher though.
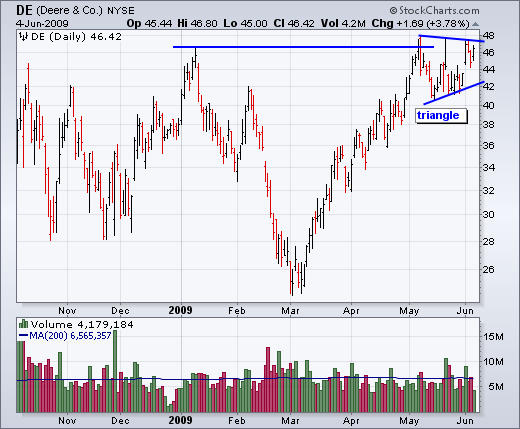
Deere (DE) surged to resistance from the January high and formed a small triangle in May. The stock surged off triangle support this week and looks poised for a breakout.
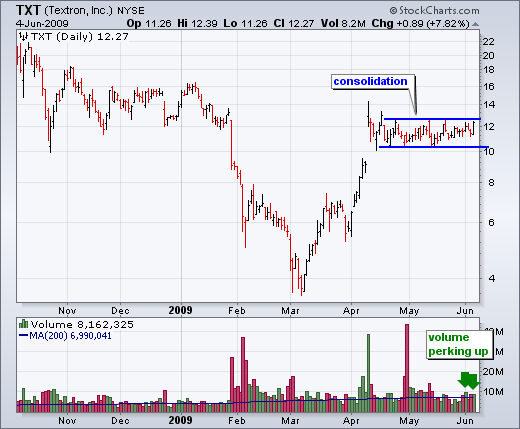
After a surge in March-April, Textron (TXT) consolidated the last six weeks. The stock held up pretty well throughout May and upside volume perked up this week. A break above consolidation resistance would be bullish for this conglomerate.
*****************************************************************
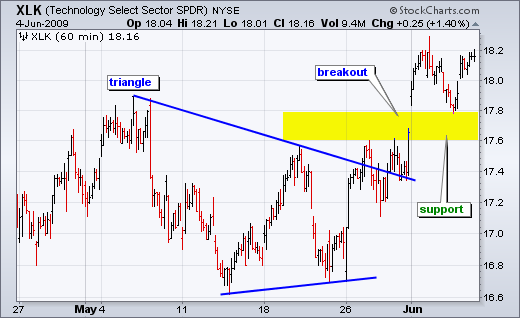
The Technology SPDR (XLK) has been the top performing sector over the last few weeks. On the 60-minute chart, XLK surged above triangle resistance with a big move on Friday and Monday. Broken resistance and the gap combine to mark a support zone (yellow). XLK successfully tested this support zone with a dip and bounce this week. I would consider this breakout bullish until proven otherwise with a move below 17.6.
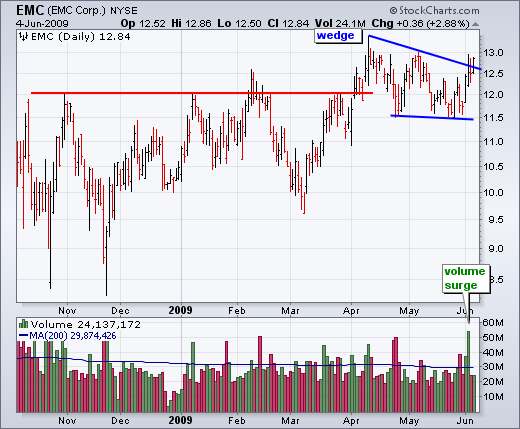
Within the sector, EMC Corp (EMC) broke resistance in April and then consolidated with a falling wedge. The stock surged with good volume earlier this week and closed above wedge resistance on Thursday. Note that EMC is currently in a bidding war with Network Appliance (NTAP) for Data Domain (DDUP). Looks like Data Domain shareholders are the big winners here.
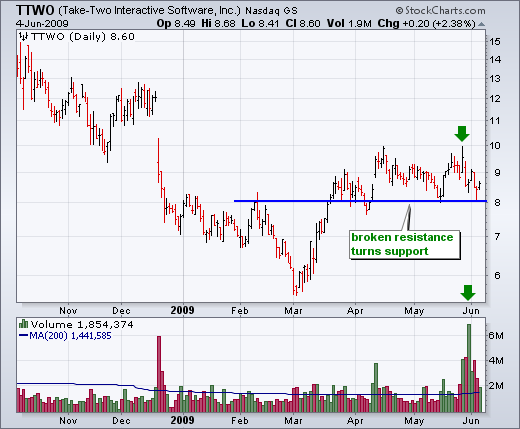
Take-Two (TTWO) is part of the game software group. Recent moves from ATVI, ERTS and THQI show some promise for the group. TTWO broke resistance in March and held this breakout throughout April, May and June. Trading has gotten rather volatile of late with some high volume swings, but the stock is holding the breakout. A solid bounce off support here could lead to a nice move.
*****************************************************************
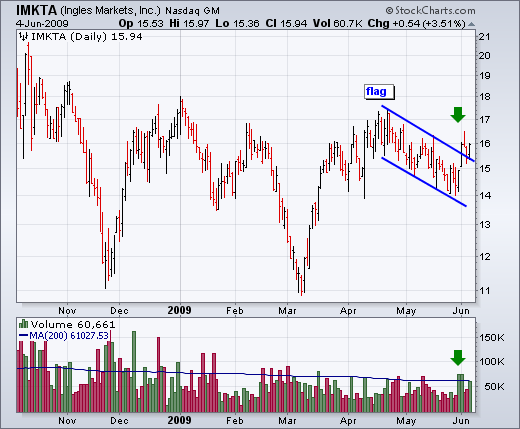
In case you have not noticed, there is a pattern that is quite common throughout the charts right now. It is a surge followed by a flag or wedge consolidation. The surge occurred in March-April and the correction occurred in May. Ingles Markets (IMKTA) surged to resistance in mid April and then corrected with a falling flag in May. The stock broke above flag resistance with a high volume surge this week. You know the drill. The breakout is bullish until proven otherwise.
*****************************************************************
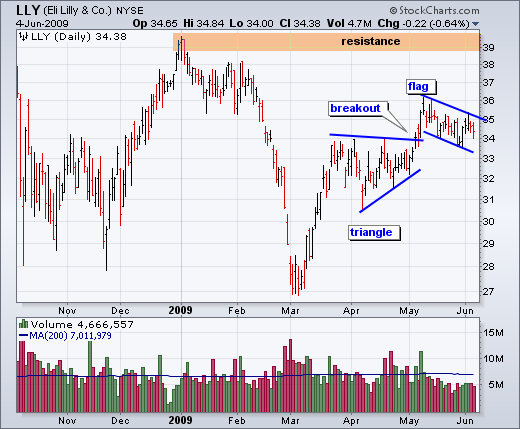
Eli Lilly (LLY) broke triangle resistance with a surge in early May and then formed a falling flag. Volume contracted as the flag unfolded with a correction back to 34. A break above flag resistance would signal a continuation of the May surge and target a move to the next resistance zone.
*****************************************************************
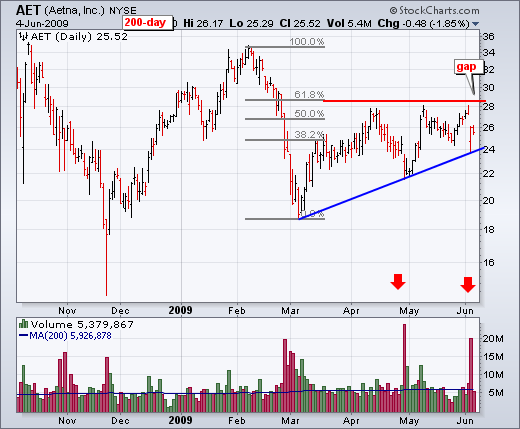
Most of my setups are bullish because the major index ETFs are in bull mode right now. There are, however, always a few bearish setups around. Aetna (AET) was featured with a rising wedge break in April, but the stock surged to resistance two more times. Resistance around 28 stems from the 62% retracement mark and the April-June highs. The most recent failure occurred with a gap down on high volume. This gap is bearish as long as it holds.
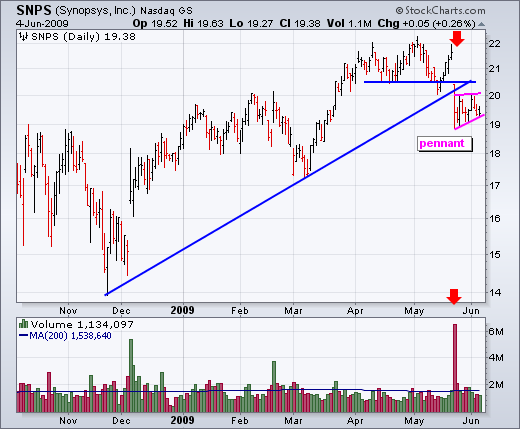
Synopsys (SNPS) broke support with a big gap on high volume in late May. After this support break, the stock was oversold and consolidated with a pennant formation. A break below pennant support would signal a continuation lower.
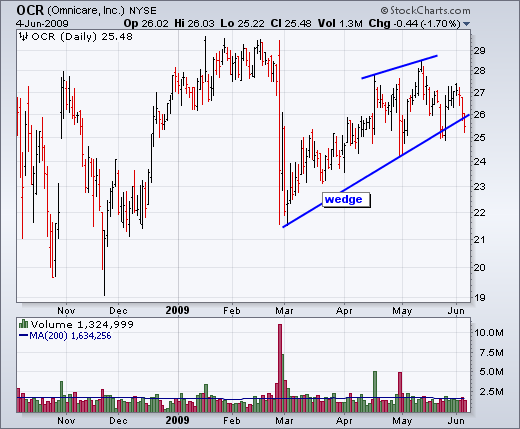
Omnicare (OCR) plunged in late February and then formed a rising wedge over the last few months. The stock hit resistance around 27-28 the last 7-8 weeks and declined rather sharply the last three days.
*****************************************************************

