- Charts Worth Watching: $INDU, ACN, ATHR, BDK, DHI, JPM, KRE, PKI, QQQQ, RJF, TGT, USB, XHB
- Link to today's video.
- The next update will be Friday (June 12) by 9AM ET.
*****************************************************************
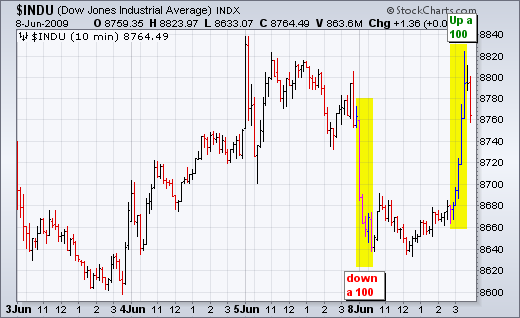
As evidenced by yesterday's last hour surge, trading remains quite tricky right now. The first chart shows 10 minute bars for the Dow Industrials. The Dow plunged over 100 points in the first hour of trading, firmed and then surges over 100 points in the final hour of trading. Talk about a whipsaw.
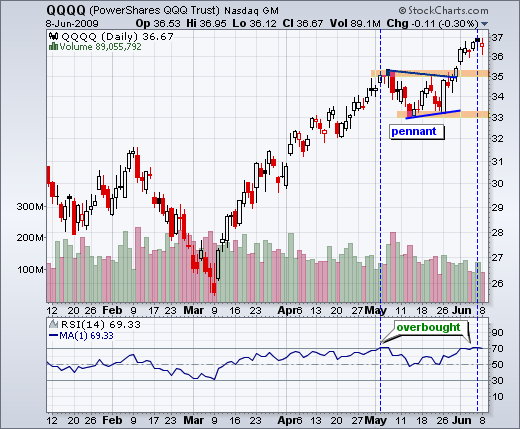
There are two important currents running through the stock market right now. Even though I am only showing an example using QQQQ, the charts for SPY, DIA and IWM show similar characteristics. First, the daily charts reflect a clear uptrend that is overbought again. QQQQ broke pennant resistance with a surge above 35 and 14-day RSI moved above 70 for the first time since early May. While overbought readings are a sign of underlying strength, they also caution that prices have perhaps run too far too fast. After all, QQQQ is now up around 30% since early March. This makes QQQQ, and by extension the other major index ETFs, vulnerable to a correction or a choppy trading range.
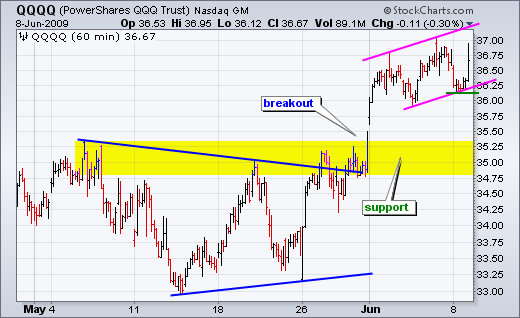
Even though QQQQ is medium-term overbought, the short-term trend is clearly up after the recent breakouts. DIA, IWM, QQQQ and SPY all broke consolidation resistance and these breakouts are holding for now. For QQQQ, broken resistance around 35 turns into the first support zone to watch. A strong breakout should hold and a move back below this support zone would indicate that the bulls are getting cold feet. This breakout should be considered bullish unless it fails to hold.
*****************************************************************
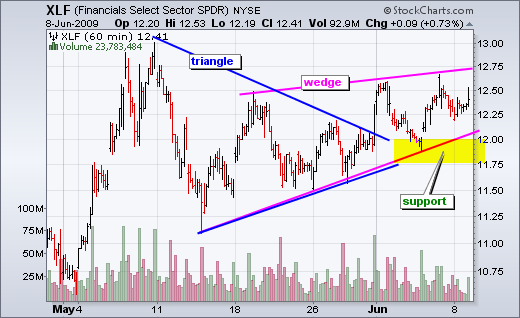
Financials remain in the spotlight. Last week I showed a chart of the Financials SPDR (XLF) with two patterns at work. The first, a triangle breakout, is confirmed and remains in play. The second, a rising wedge, is potential and remains something to watch for future developments. Technically, the short-term trend is up as long as this wedge rises. A break below the lower trendline and the yellow support zone would reverse the rise and signal the start of a downtrend. Notice that I raised the support zone from 11.50-11.75 to 11.75-12.00.
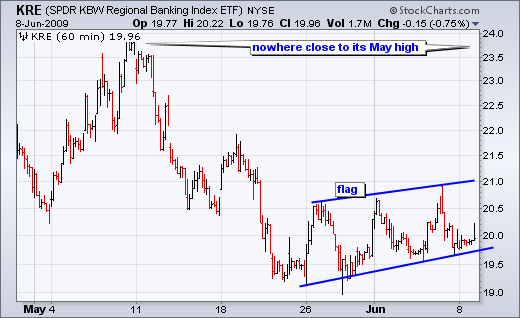
I am also concerned with relative weakness in the Regional Bank SPDR (KRE). While the S&P 500 ETF (SPY) broke above its May high in early June, KRE did not even come close to its May high. This shows some serious relative weakness. The ETF declined sharply in May and then formed a rising flag (consolidation) over the last few weeks. A break below flag support would signal a continuation lower. Needless to say, such a break would weigh on the finance sector and the market overall.
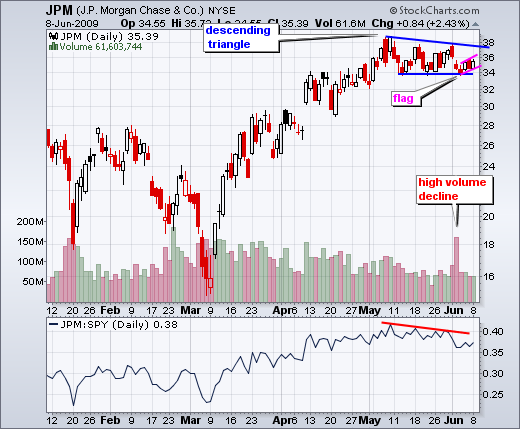
Within the finance sector, JP Morgan Chase (JPM) shows relative weakness as a descending triangle takes shape. The stock peaked in early May, formed lower highs and tested support around 34 over the last few weeks. JPM did not follow SPY higher with a consolidation breakout. The bounce over the last 3-4 days formed a small rising flag/wedge and there is resistance around 36 from last week's gap down. A break below the June low would be short-term bearish and argue for a retracement (correction) of the March-May advance.
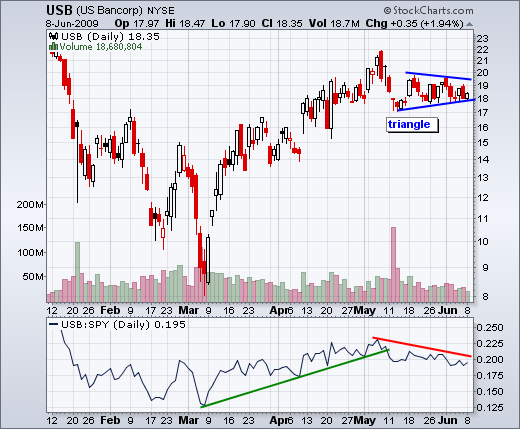
US Bancorp (USB) firms after sharp decline. USB was hit hard in early May with a sharp decline below 18. The stock then stabilized by forming a triangle consolidation the last few weeks. Watch these boundaries for the next directional clue. A break above the June high would be bullish, while a break below the June low would be bearish. USB shows relative weakness with price relative falling the last few weeks. A trendline break is needed to reverse this relative weakness.
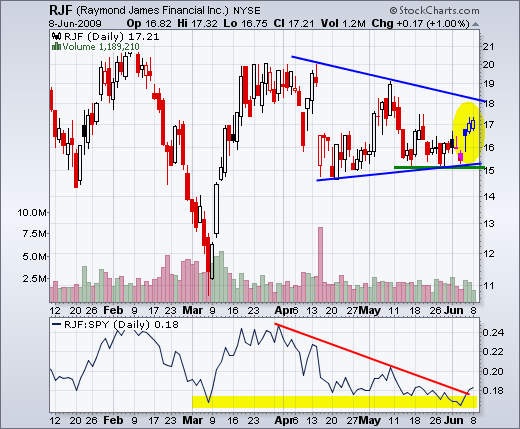
Despite my concerns with relative weakness in the finance sector, I was intrigued with recent strength from Raymond James Financial (RJF). The stock has been lagging the finance sector and the market since early April. Despite relative weakness, RJF managed to hold support around 15 throughout May. With a little help from the market, the stock surged last Thursday and managed to move higher on Friday and Monday. This move reinforces support at 15, a break of which would be most bearish.
*****************************************************************
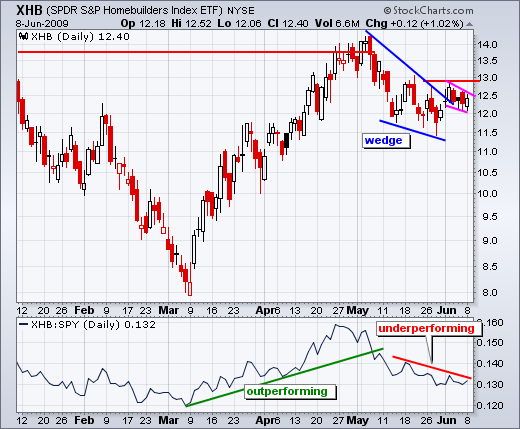
The Homebuilders SPDR (XHB) bucked the market yesterday with a modest gain on the day. However, the ETF remains an underperformer over the last few weeks and short of a breakout. While SPY trades above its May high, XHB is trading well below its May high. In addition, the price relative has been moving lower since late April. On the price chart, XHB broke wedge resistance with a surge in early June and then consolidated the last 4-5 days. A break above this consolidation is needed for follow through and to fully reverse the downtrend here. A breakout in the Homebuilders SPDR would be quite positive for the market. Let's see it first.
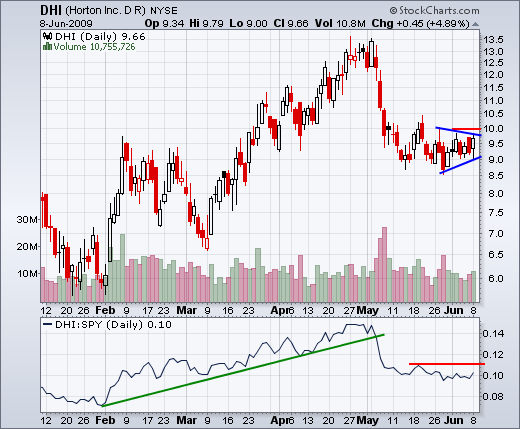
Within the group, DR Horton (DHI) surged almost 5% on Monday. Is this the beginning of a breakout or a head fake? The stock did not break resistance at 10 and I would like to see follow through to Monday's move. A small triangle is taking shape and we can watch these boundaries. A break above 10 is bullish, while a break below 9 would be bearish.
*****************************************************************
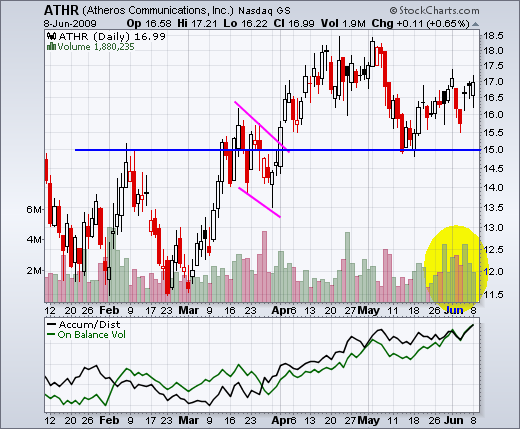
Atheros Communications (ATHR) is showing signs of accumulation with a series of high volume advances over the last two weeks. The stock broke resistance with a surge in March-April. Broken resistance turned into support around 15 as the stock bounced in mid May. Despite a sharp pullback last week, the stock rebounded with good volume the last three days. Also notice that On Balance Volume (OBV) and the Accumulation Distribution Line both moved to new highs this week.
*****************************************************************
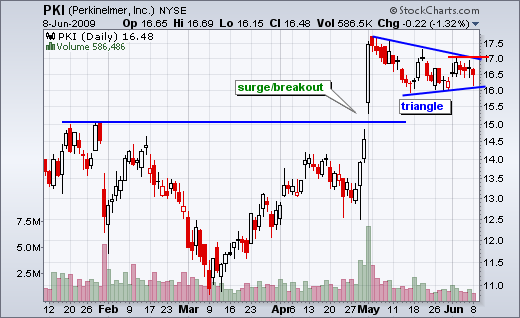
After a high volume breakout in late April, Perkin Elmer (PKI) is forming a bullish consolidation. The stock broke resistance at 15 with a huge move on big volume. PKI was clearly overbought after this move and the triangle consolidation worked off this overbought condition. Look for triangle break to provide the next directional clue. A break above 17.10 would be bullish, while a break a below 16 would argue for a deeper pullback.
*****************************************************************
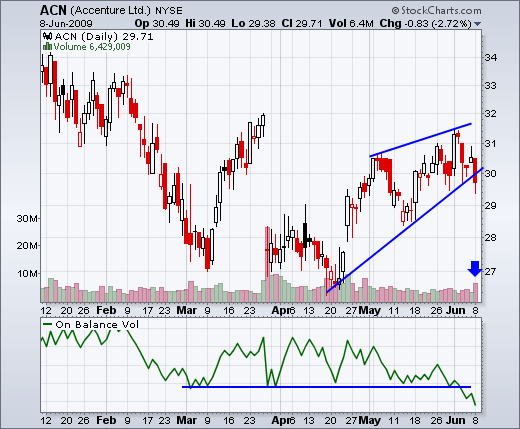
Accenture (ACN) breaks wedge trendline with surge in volume. Even though the stock surged with the rest of the market in early March, it was dealt a big setback with a plunge towards the end of the month. ACN recovered with a move back above 30 in early May, but has not been able to consistently hold above 30. Most recently, the stock broke the lower trendline of a rising wedge with a sharp decline yesterday. Downside volume also picked up as On Balance Volume (OBV) broke below its March-May lows. Granville, the developer of OBV, theorized that volume precedes price. If this is the case, then ACN appears headed lower.
*****************************************************************
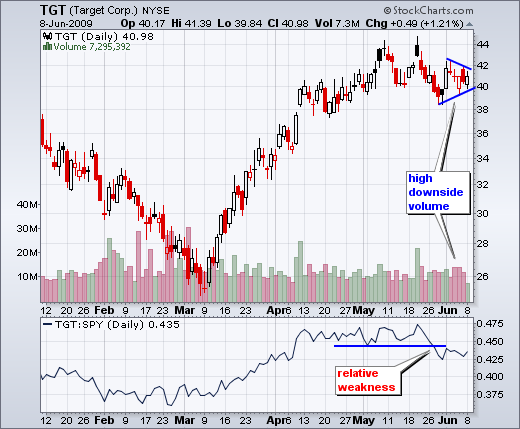
Target (TGT) started showing relative weakness in May and has yet to recover in June. TGT reversed at resistance (44) in mid May and declined below 40. After this sharp decline, the stock formed a triangle consolidation with flat trading. Downside volume has been outpacing upside volume during the consolidation. In addition, the price relative broke below its May lows and remains weak. A break below triangle support would argue for a continuation of the May decline.
*****************************************************************

