- Charts Worth Watching: $USD, AAPL, BBBY, CHKP, CSCO, DHI, ENR, FXE, GLD, INTC, IWM, K, KFT, NVDA, PEP, QQQQ, SLE, SPY, SWK, WAG, WHR
- Click here for today's video.
The next update will be Tuesday (June 22) by 9AM ET.
*****************************************************************
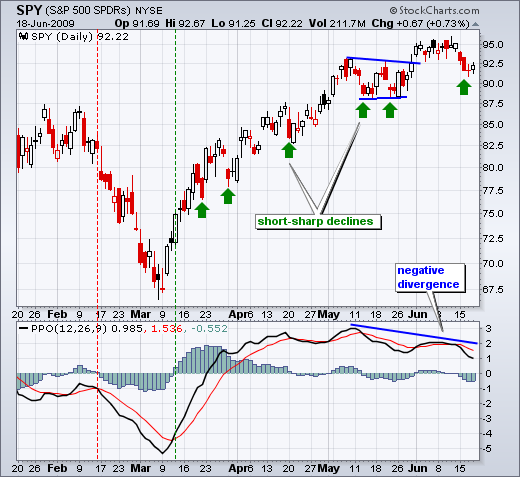
It is touch-and-go in the stock market right now. The medium-term trends for the major index ETFs remain up on the daily charts, but upside momentum is waning and signs of weakness are starting to appear. On the SPY chart, the Percentage Price Oscillator (PPO) formed a negative divergence and moved below its signal line this week.
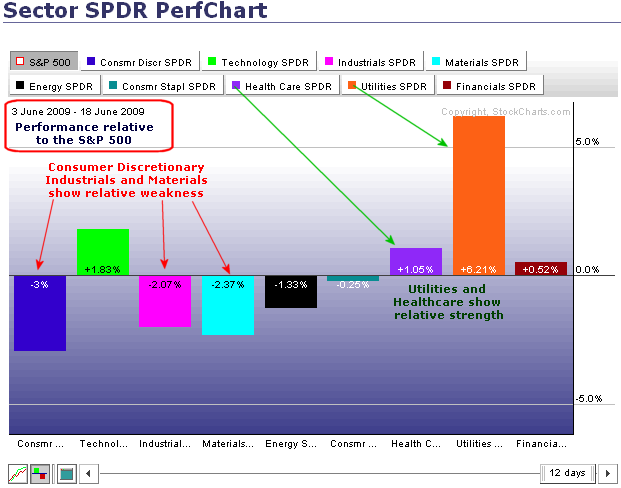
Sector rotations suggest a move into more defensive areas of the market. I am seeing relative weakness in the consumer discretionary and its related industry groups (retail, housing). Conversely, I am staring to see relative strength in the defensive sectors (consumer staples, healthcare and utilities).
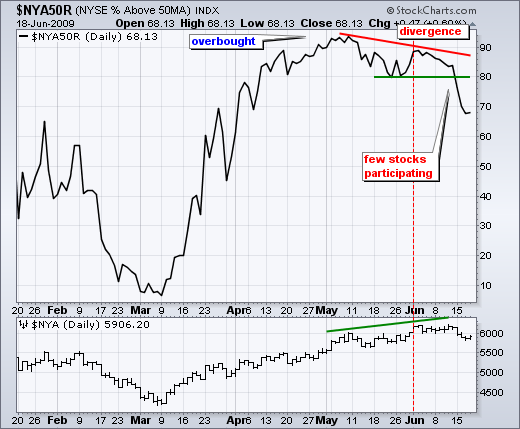
Broad market breadth has been weakening the last few weeks. Negative divergences formed as fewer NYSE and Nasdaq stocks were above their 50-day moving averages in June. In addition, the AD Volume Line for the NYSE formed a negative divergence with a lower high in June.
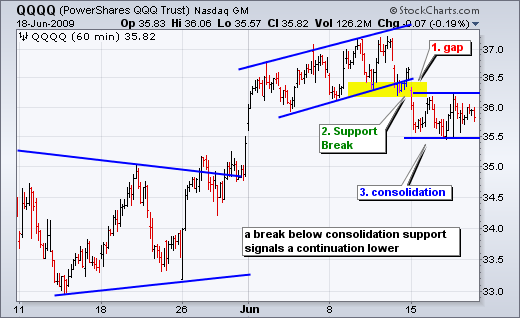
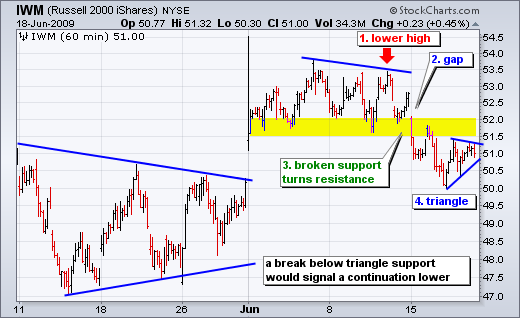
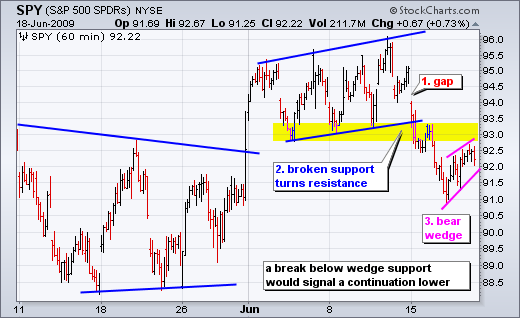
Stocks were hit pretty hard late last week and early this week, but managed to firm on Wednesday and Thursday. As noted in yesterday's market message, a three day decline of 3.5% is pretty normal in a medium-term uptrend. See the green arrows on the daily SPY chart above. Anything more would be considered abnormal and increase the chances of a medium-term trend reversal. What happens after the Wednesday-Thursday consolidations holds the first clue. QQQQ formed a flat consolidation, SPY formed a rising wedge consolidation and IWM formed a small triangle consolidation. Short-term support breaks from here could have medium-term implications.
*****************************************************************
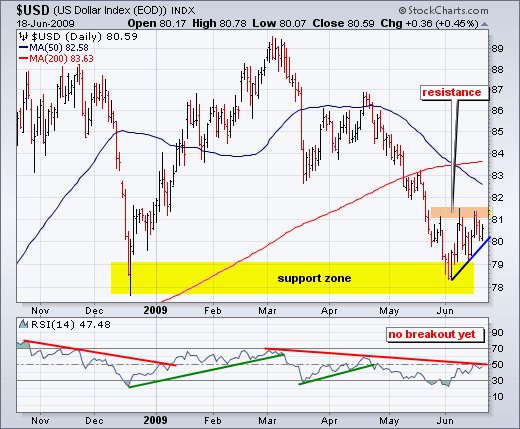
Gold remains heavily reliant on the US Dollar for direction. With the US Dollar Index ($USD) getting a bounce in June, the Gold ETF (GLD) fell quite sharply over the last 2-3 weeks. The US Dollar Index has yet to break resistance just above 81 and RSI has yet to break above 50. The Dollar firmed on Thursday, but we need to see a breakout before calling a trend reversal.
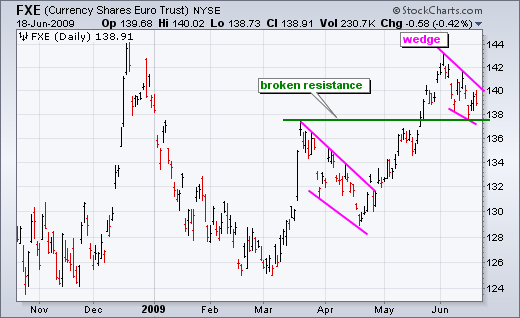
While the Dollar bounced in June, the Euro ETF (FXE) pulled back to broken resistance with a falling wedge. These are potentially bullish consolidations and a break above wedge resistance would be bullish for the Euro and gold.
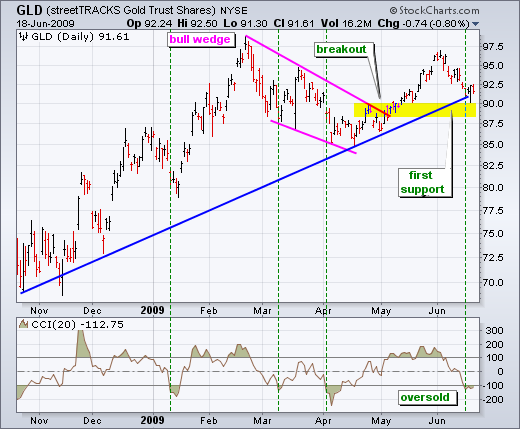
The Gold ETF (GLD) is also hitting a support area from broken resistance and the November trendline. In addition, CCI is oversold for the fourth time this year. Prior oversold readings foreshadowed a bounce within 1-5 days (green dotted lines). The indicator has been oversold for four days now. A lot depends on the Dollar.
*****************************************************************
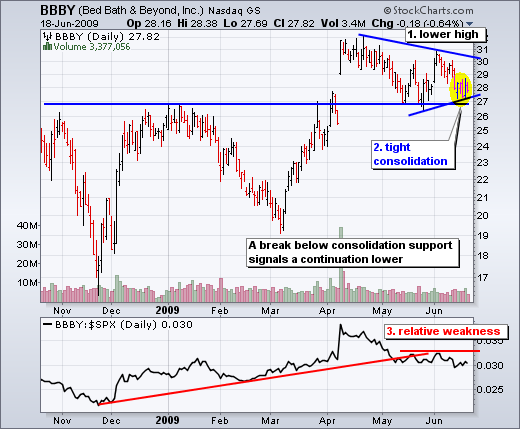
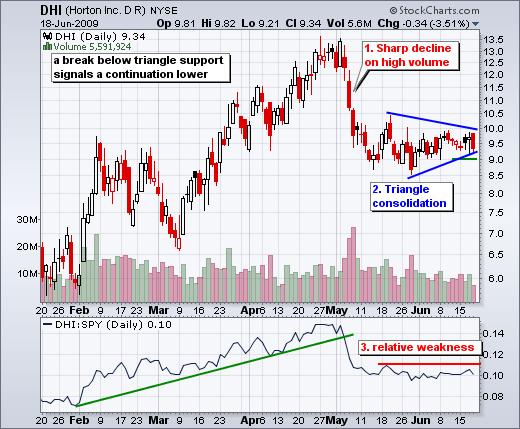
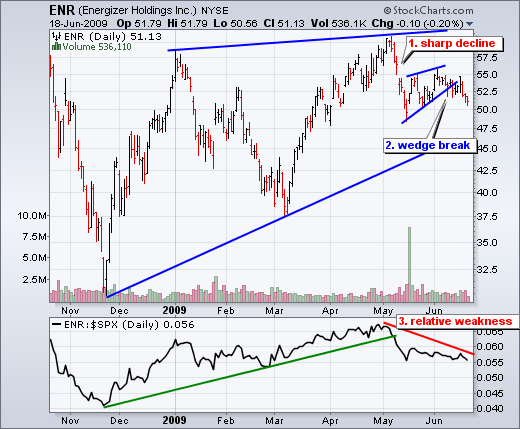
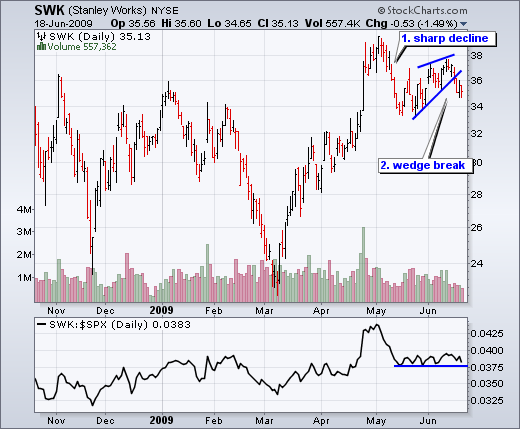
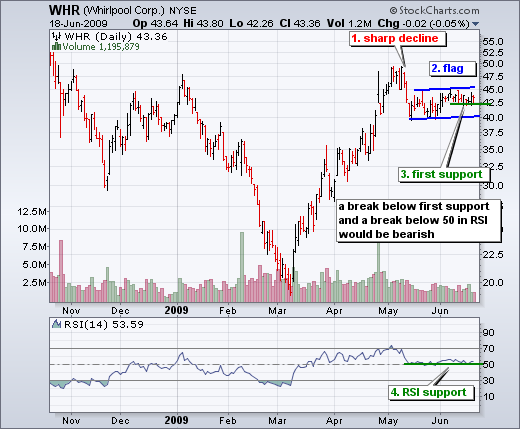
The first group of stocks comes from the consumer discretionary, which I have been picking on the last few weeks. These setups are bearish because the consumer discretionary is showing relative weakness when compared to the broader market. I am going to try something a little different by putting all the information on the actual chart.
*****************************************************************
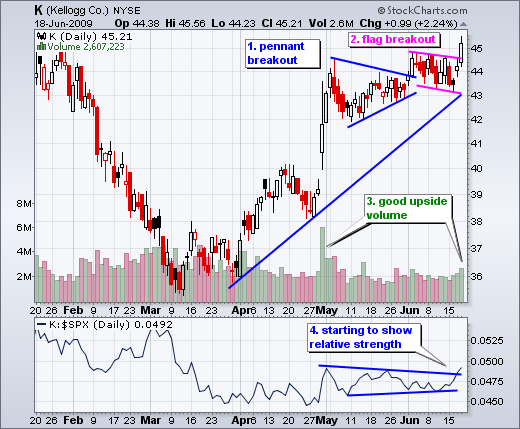
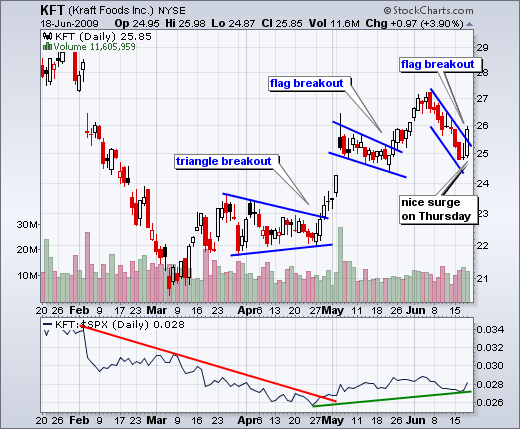
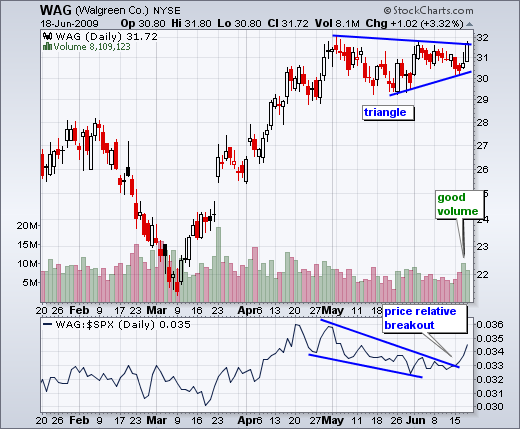
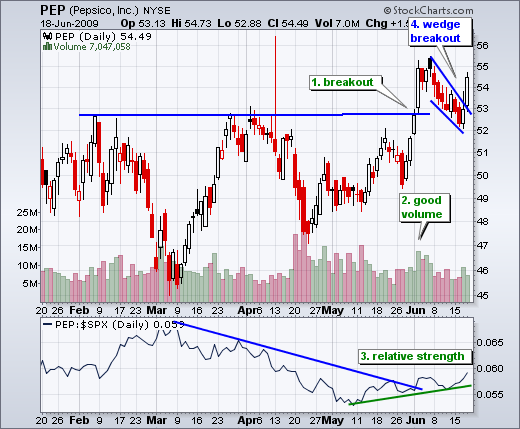
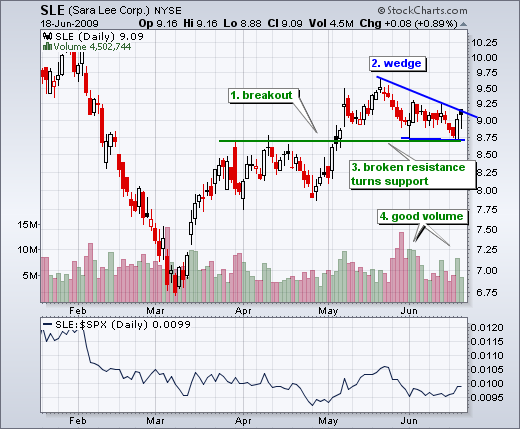
The next group of stocks comes from the consumer staples sector, which showed relative strength with a big surge yesterday. As noted above, this is a defensive area of the market that benefits from broad market weakness.
*****************************************************************
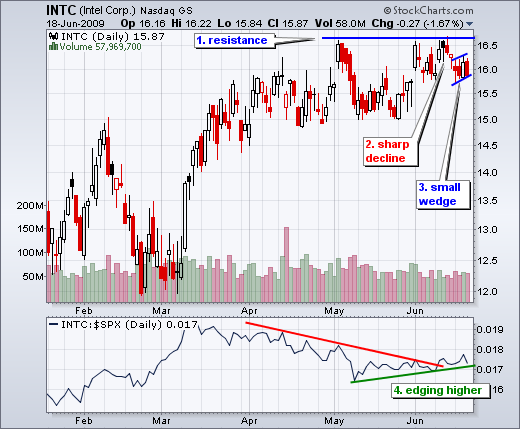
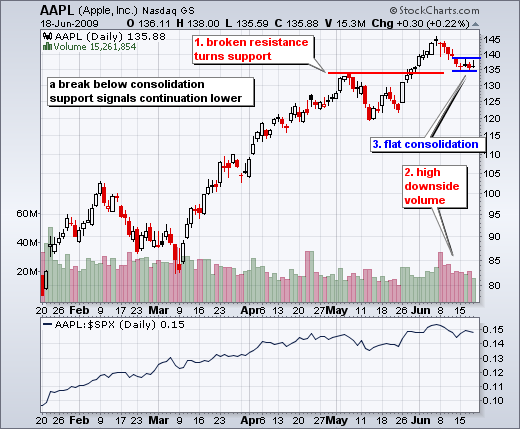
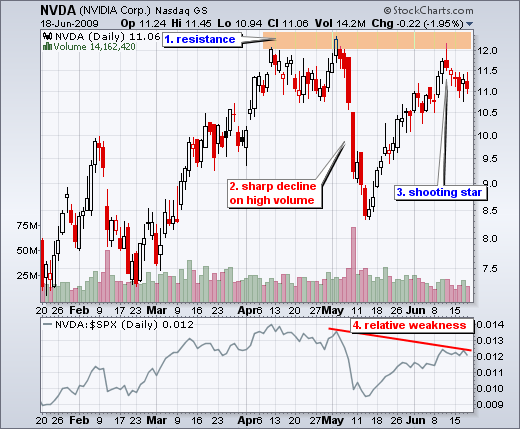
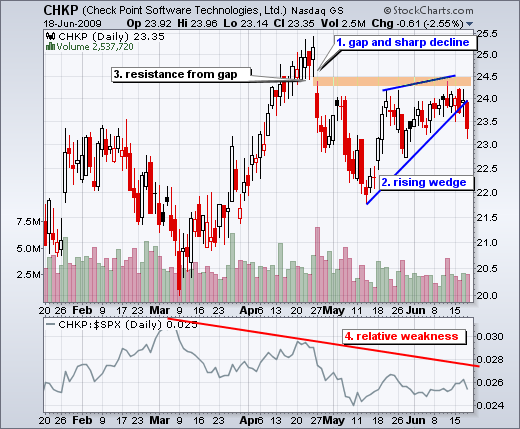
The technology sector has been leading the market over the last few weeks. Even with relative weakness in the consumer discretionary, the technology sector held up quite well in June. Even so, I am seeing some bearish setups in some key tech stocks.
*****************************************************************

