- Charts Worth Watching: $USD, BBY, CI, EL, GDX, GLD, IPCR, KMB, LLL, MHP, RTN, SPY, XLF , XLK, XLV, XLY
- Click here for today's video.
- The next update will be Friday (June 19) by 9AM ET.
*****************************************************************
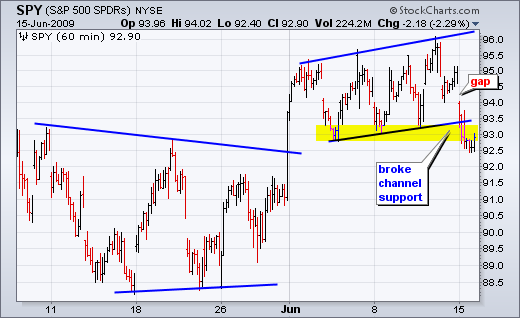
With a sharp decline over the last two days, the major index ETFs are already short-term oversold. I pointed out the rising channels on Friday and the major index ETFs all broke below channel support on Monday. These breaks reversed the short-term uptrends, but the decline was not enough to reverse the medium-term uptrends. A short-term downtrend within a medium-term uptrend is considered a corrective move that will forge a higher low. In other words, it is expected to end sooner rather than later. One day we will see a deep enough short-term decline to reverse the medium-term uptrend. Until that day comes, oversold readings could give way to oversold bounces.
The first chart shows 60-minute bars for the S&P 500 ETF (SPY). SPY broke channel support and moved to its lowest level of the month yesterday. In addition, the ETF stayed down after the gap. Even though the gap and channel break are short-term bearish, the ETF declined over 3.5% from high to low over the last two days. That's a pretty sharp decline that created a short-term oversold situation.
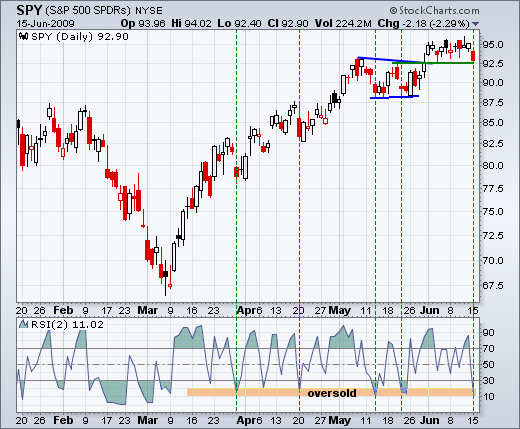
On the daily chart, 2-period RSI is already trading in the 10-20 range, an area that marked oversold conditions from March until May (orange rectangle). With the medium-term trend still up and the short-term trend already oversold, we could see a bounce in the coming days. Should a bounce materialize, we need to judge volume, breadth and sector participation to ascertain the strength or lack thereof. A weak bounce would likely encounter resistance from yesterday's gap (94-95) and retrace 50-62% of the two day decline. The charts for DIA, IWM and QQQQ show similar characteristics and the same login can be applied.
*****************************************************************
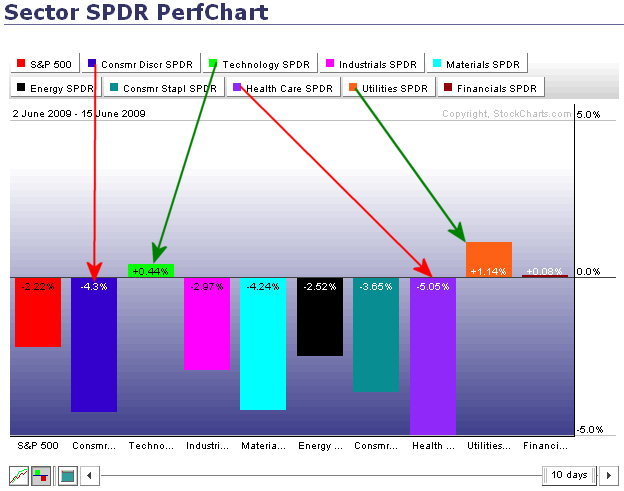
Consumer discretionary and Healthcare are the weakest sectors for June. The PerfChart below shows sector performance from 2-June until 15-June. The S&P 500 is down around 2.22% over this two week period. Six of the nine sectors are down as well and all six are down more than the S&P 500. These six show relative weakness with the consumer discretionary and healthcare sectors leading the way lower.
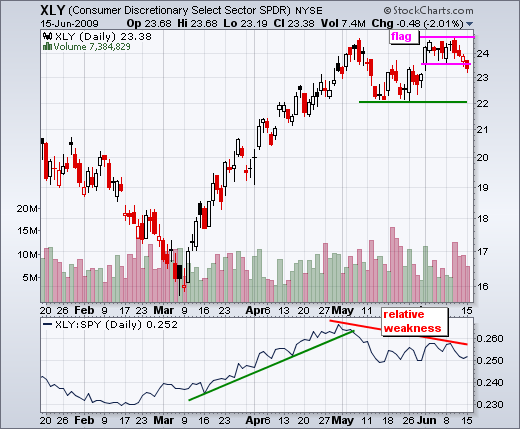
The Consumer Discretionary SPDR (XLY) started showing relative weakness when it failed to exceed its May high. A flat flag formed in June, but the ETF broke to the downside instead of the upside. It is negative to see the most economically sensitive sector showing relative weakness.
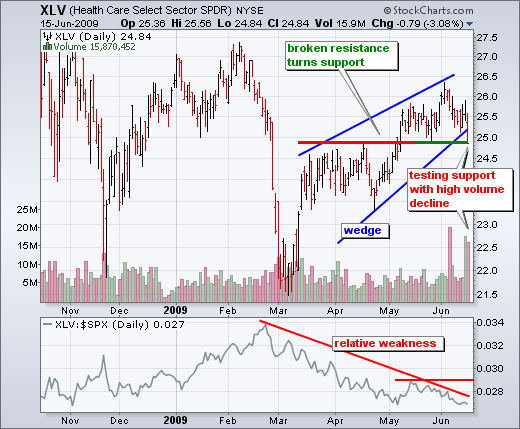
Healthcare was considered defensive, but money did not rotate into this sector over the last two weeks. That's a bad sign. The Healthcare SPDR (XLV) is now testing rising wedge support and showing relative weakness. Perhaps the healthcare sector has healthcare reform on its mind. This creates a big uncertainty for the large pharmaceutical companies and healthcare providers.
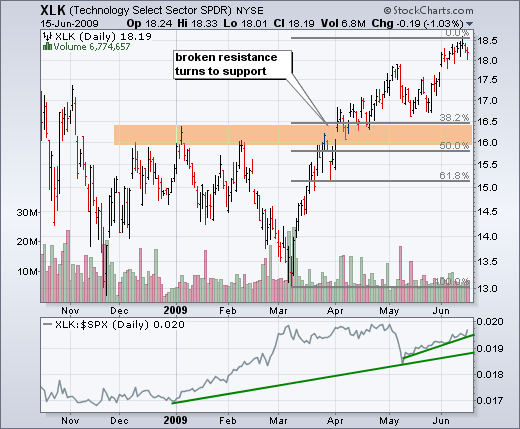
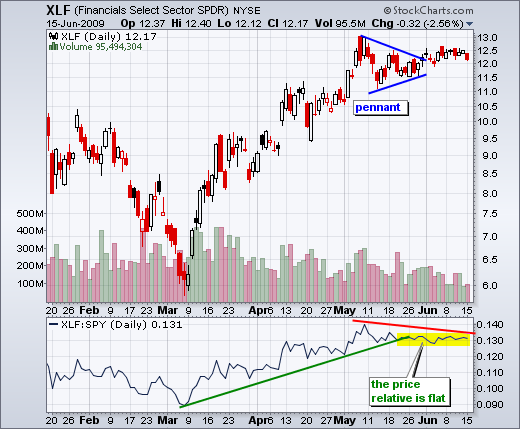
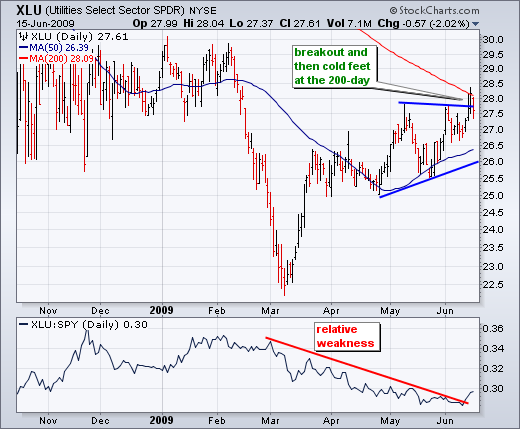
On the plus side, the technology and utilities sectors are showing relative strength with modest gains over the last two weeks. In addition, the finance sector managed to eke out a fractional gain. Relative weakness in technology is a positive, but this is offset by relative weakness in the consumer discretionary sector and other sectors.
*****************************************************************
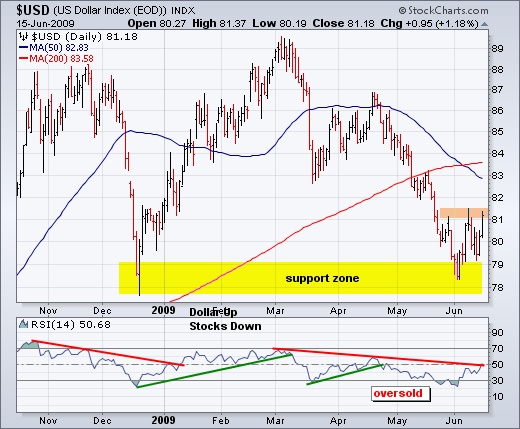
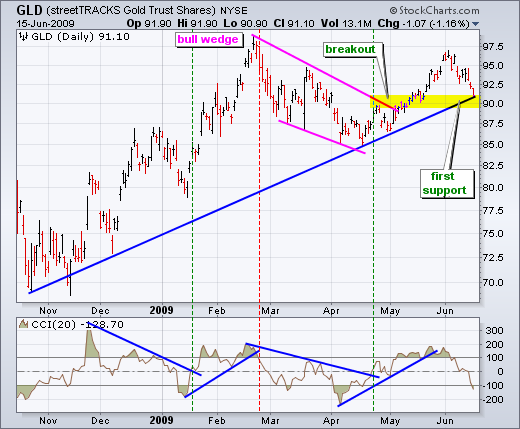
The Gold ETF (GLD) hit trendline support and became oversold on Monday. Money moved out of gold as the Dollar surged on Monday. John Murphy featured the Dollar bouncing off its support zone in early June and again yesterday. The US Dollar Index ($USD) is showing signs of life this month with a move back above 80. There is some resistance just above 81 and RSI is trading just above 50. A breakout could be in the works for both and this would be bearish for bullion.
GLD is down over 6% this month with a decline from 97 to 91. In addition, a lower high formed as the ETF failed to exceed its February high. Despite this lower high, GLD is nearing a support zone around 90 as the Commodity Channel Index (CCI) becomes oversold with a dip below -100. This is a big test for bullion.
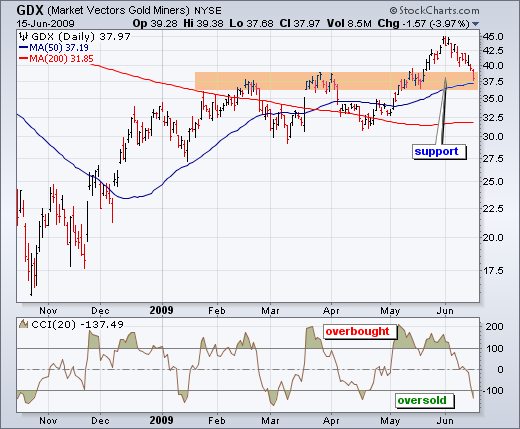
The Gold Miners ETF (GDX) is also nearing a support zone. Broken resistance around 37.5 turns into support. In addition, CCI 20 moved below -100 for the first time since April. Notice how the overbought and oversold readings in CCI corresponded with the peaks and troughs in GDX this year. With CCI oversold and the ETF at support, we could see a bounce or some firmness.
*****************************************************************
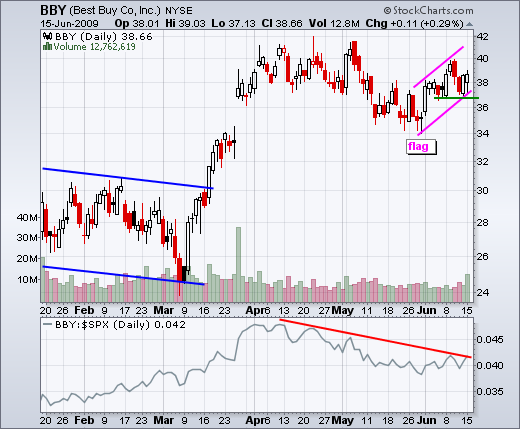
Best Buy (BBY) bucked the market by posting a small gain on the day. In fact, the stock was up on above average volume. Overall, the June advance looks like a rising flag with support based on last week's low. The bulls have an edge as long as the flag rises. A break below flag support would signal a continuation lower.
*****************************************************************
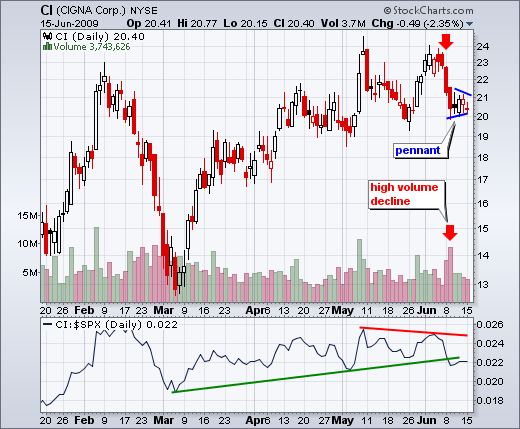
After a high volume decline last week, Cigna (CI) formed a pennant over the four trading days. The stock became short-term oversold after this sharp decline and the pennant consolidation worked off these oversold conditions. A break below pennant support would signal a continuation of last week's decline.
*****************************************************************
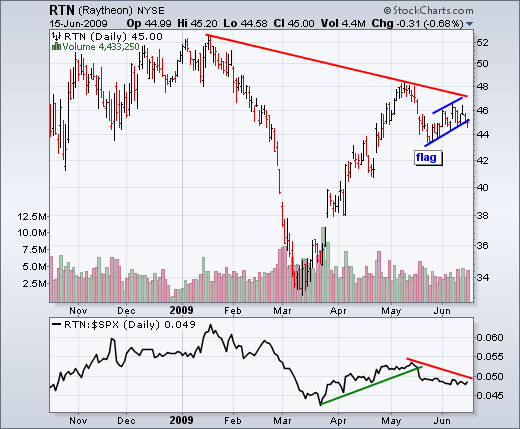
The next two stocks come from the defense industry, which is part of the industrials sector. Raytheon (RTN) led the market higher from mid March to early May, but has started showing relative weakness over the last few weeks. The stock failed to exceed its May high and formed a rising flag, which is potentially bearish. RTN closed right at flag support on Monday and further weakness could signal a continuation of the May decline.
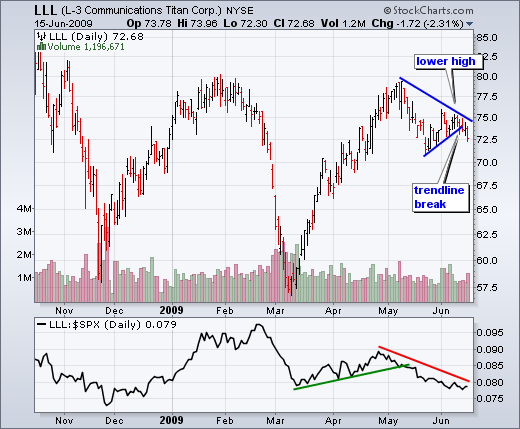
L-3 Communications (LLL) is also showing relative weakness as the price relative (LLL:$SPX ratio) moves lower. The stock peaked in May, formed a lower high in early June and broke a short trendline on Monday.
*****************************************************************
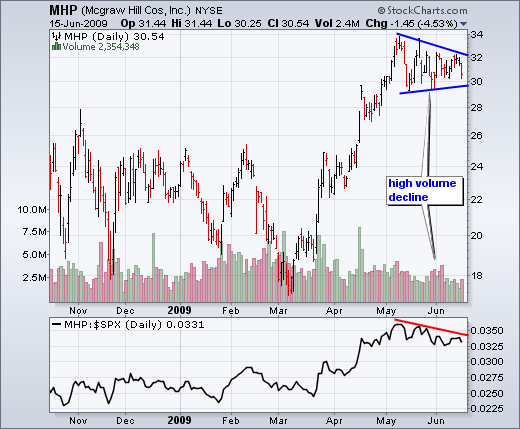
McGraw Hill (MHP) formed a triangle over the last few weeks and failed to exceed its May high. Within the triangle, the stock declined on above average volume in late May and early June. This suggests that selling pressure is picking up. Watch the triangle boundaries for a break.
*****************************************************************
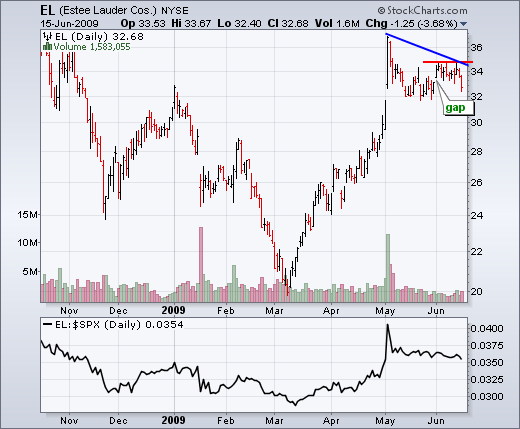
Estee Lauder (EL) fills the gap. This is another one that went ballistic during the March-May advance. In fact, that advance is down right parabolic. After settling down in the 32-35 area, the stock gapped up at the beginning of June. However, this gap did not hold as EL declined back below 33 on Monday. The inability to hold the gap shows weakness.
*****************************************************************
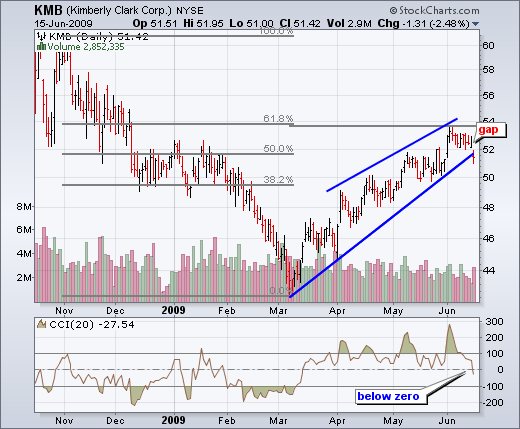
Kimberly Clark (KMB) met resistance from a key retracement and gapped down on Monday. After a decline from November to March, the stock retraced 62% with an advance back to the 54 area. This advance was in good shape until KMB gapped down and broke the wedge trendline yesterday. Also notice that CCI moved into negative territory for the first time since mid March. The tide appears to be turning for KMB.
*****************************************************************
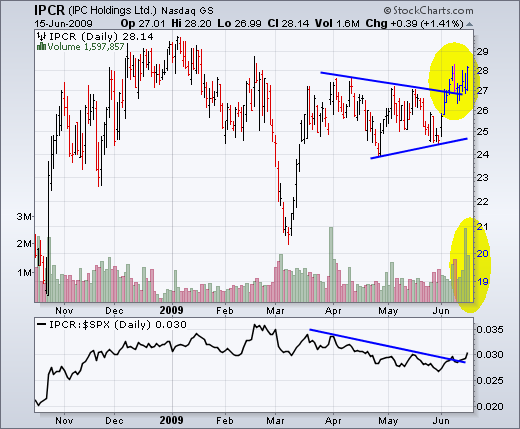
IPC Holdings (IPCR) is showing strength with a high volume breakout over the last few days. The stock surged in March and then consolidated with a triangle into May. There was a breakout surge in early June, a pullback and then another surge over the last four days. This second surge broke back above triangle resistance with good volume.
*****************************************************************

