- Charts featured: DHI, DIA, IBB, IWM, JAH, JPM, LUV, MMC, PENN, PNRA, QQQQ, SPY, USB, WFC, XHB, XLF, XLY
- Link to today's video.
- Next update will be Tuesday (July 7) by 9AM ET.
*****************************************************************
As noted last week, the current trading environment remains tricky for a number of technical and fundamental reasons. On the fundamental side, portfolio window dressing will draw to a close as second quarter winds down this week. This will give way to earnings season, which begins in mid July. Most companies are scheduled to report from the 20th until the 30th of July. Summer is also kicking into gear and this could depress volume. With earnings season still three weeks away, this means we could see listless trading the next couple of weeks.
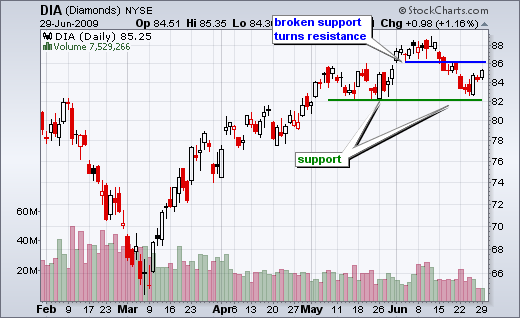
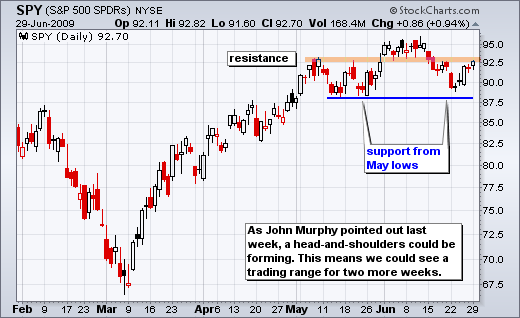
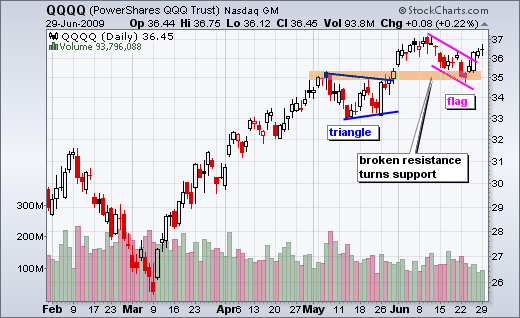
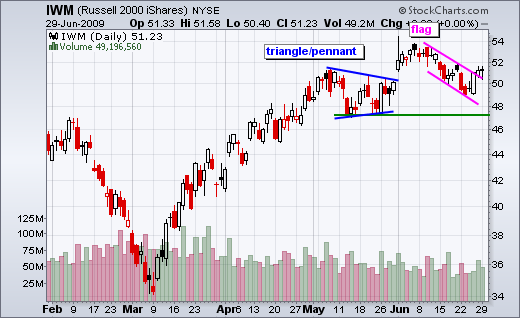
Technically, the Dow Diamonds (DIA) and S&P 500 ETF (SPY) bounced off their May lows over the last 3-5 days. Strictly speaking, the medium-term trend on the daily chart remains up as long as these May lows hold. A downtrend starts with a lower high and a lower low. DIA, IWM, QQQQ and SPY all recorded higher highs in early June. As the last reaction low, a break below the May low is needed to start a downtrend.
The Nasdaq 100 ETF (QQQQ) and Russell 2000 ETF (IWM) held above their May lows and also bounced the last few days. QQQQ broke flag resistance with a surge above 36. A strong breakout should hold. A close back below 36 would argue for a reassessment. IWM also broke above flag resistance and then stalled the last two days. A close back below 50.5 would argue for a reassessment of this breakout.
*****************************************************************
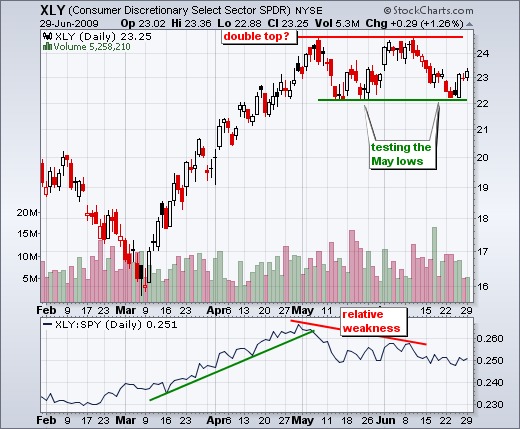
Perhaps the Consumer Discretionary SPDR (XLY) best sums up the current environment. XLY has gone nowhere as it oscillates within a trading range the last two months. XLY has support around 22 and resistance around 25. The ETF got a nice bounce off support last Thursday, but has yet to follow through on this bounce. I am watching this support zone quite closely. A break would forge a lower low and argue for further weakness. Also notice that XLY is lagging SPY as the price relative works its way lower.
*****************************************************************
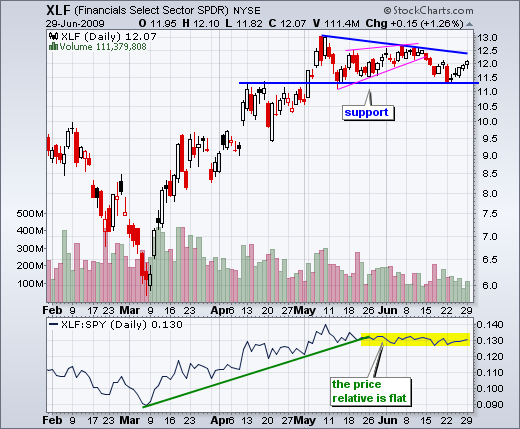
The Financials SPDR (XLF) also remains on the watch-list as it consolidates the last eight weeks. After forming a lower high in early June, XLF got a bounce off the May lows. Is this a dead-cat bounce or more? Right now, it looks like a dead-cat bounce with small up days and relatively light volume. A break below support would be bearish for XLF.
*****************************************************************
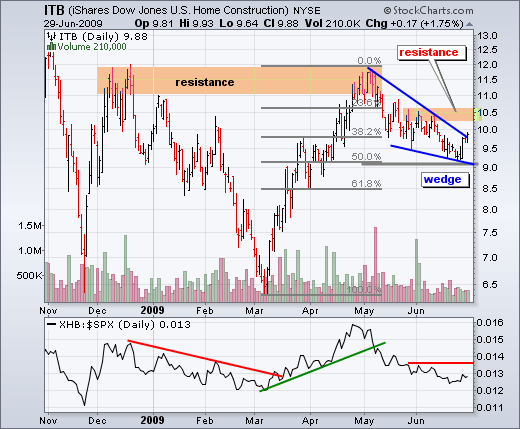
Even the lowly Homebuilders SPDR (XHB) got a bounce over the last few days. With the ETF bouncing off its 50% retracement and a falling wedge taking shape, this certainly looks like bottom picking territory. However, we need to see stronger follow through on bigger volume before considering a trend reversal.
*****************************************************************
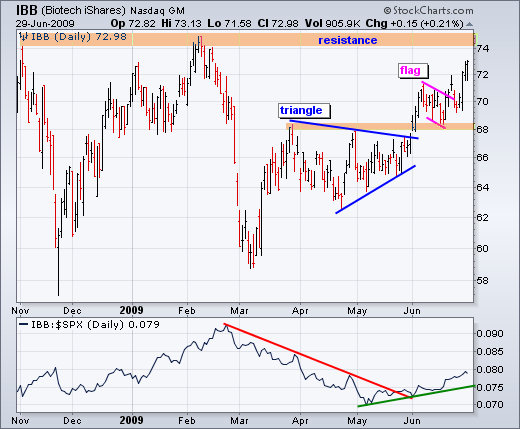
The Biotech iShares (IBB) continues to show relative strength as it surges to a four month high. Not many ETFs are trading at four month highs right now. Notice that IBB broke triangle resistance in early June and broken resistance then turned into support around 68. After a little consolidation, the ETF surged above 72 over the last two weeks. The next resistance area resides around 74-75.
*****************************************************************
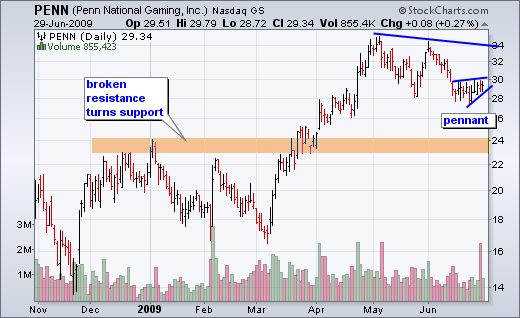
Turning to individual stocks, Penn National Gaming (PENN) formed a bearish pennant near its May lows. The stock breeched its May lows with a sharp decline on high volume in mid June. This pennant looks like a consolidation to work off oversold conditions. A break below pennant support (28) would signal a continuation lower.
*****************************************************************
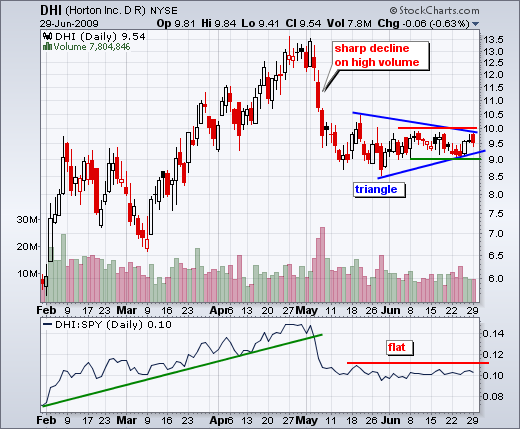
The consolidation continues for DR Horton (DHI). After a sharp decline in early May, DHI traded flat the last seven weeks. This consolidation narrowed even further the last four weeks as DHI traded between 9 and 10. The battle lines are drawn. Look for a break from this range to provide the next directional signal.
*****************************************************************
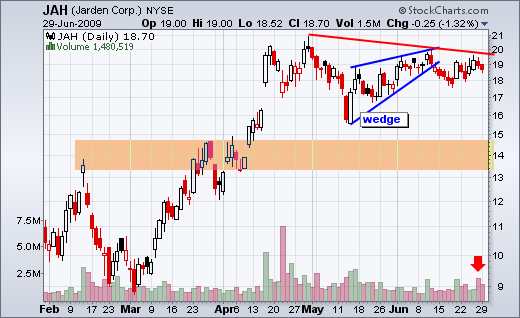
Jarden (JAH) hits resistance with a decline on increasing volume. JAH broke wedge resistance in mid June and then bounced back towards resistance over the last seven days. Resistance around 20 stems from the April-June highs and the red trendline. While a break above 20 would be bullish, the latest 2-day decline on increasing volume suggests that resistance will hold.
*****************************************************************
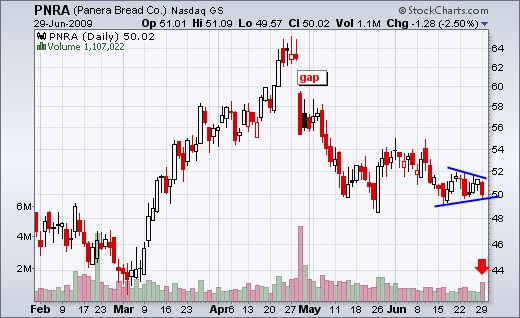
Panera Bread (PNRA) forms bearish consolidation. PNRA was hit hard in late April with a gap down and declined to around 50 in May. The stock has been consolidating the last six weeks with a small triangle taking shape the last two weeks. Selling pressure is picking up as PNRA declined with a surge in volume on Monday. A triangle break would signal a continuation lower with next support around 44.
*****************************************************************
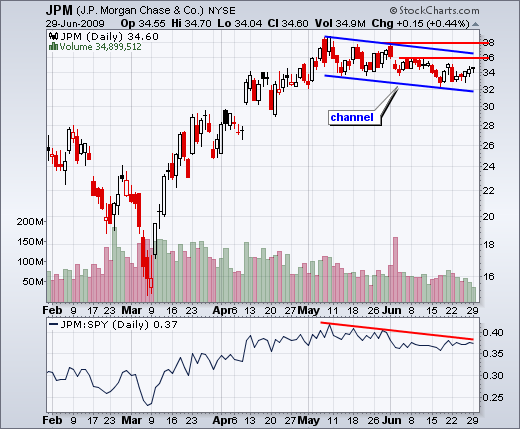
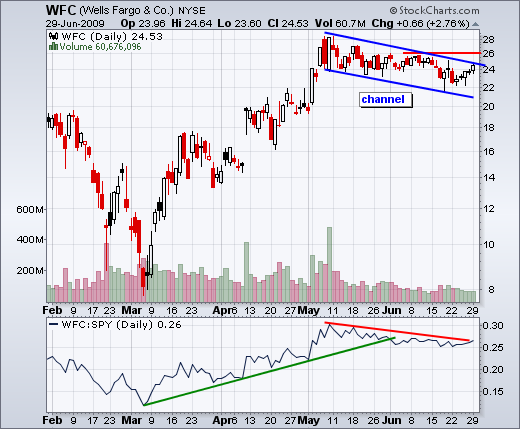
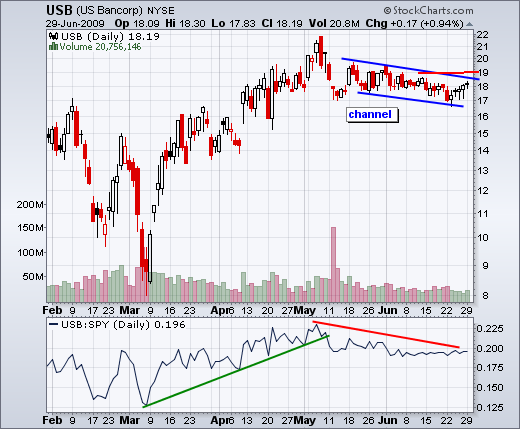
As noted with XLF above, I am still watching a number of banking stocks closely. JP Morgan Chase (JPM), Wells Fargo (WFC) and US Bancorp (USB) are all edging lower within falling price channels. All three bounced over the last few days, but have yet to actually break channel resistance, Moreover, these bounces occurred on low volume and with relatively small daily moves (tentative). A bearish bias remains as long as the channels fall. Look for upside breakouts to reverse these downtrends.
*****************************************************************
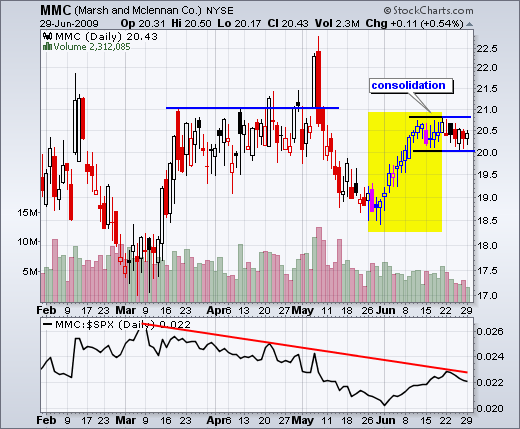
Marsh & McLennan (MMC) also remains on the radar as it consolidates after an early June advance. The black candlesticks show up days, while the red candlesticks show down days. Notice that MMC was up 15 of 17 days from late May to mid June (yellow box). This shows some accumulation and a break above consolidation resistance would be bullish.
*****************************************************************
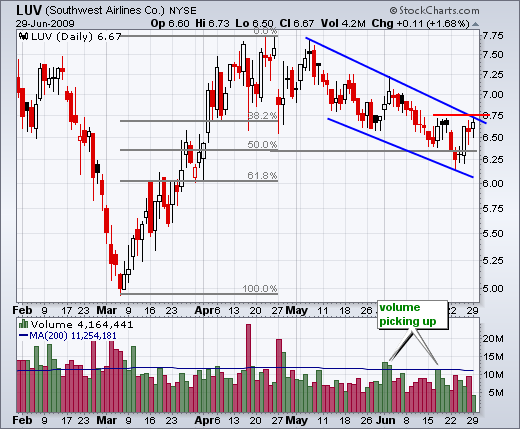
SW Airlines (LUV) surges to channel resistance. After a big advance in March-April, LUV retraced 50% with a decline to around 6.30. This decline formed a falling channel as the stock trended lower the last two months. There were some high-volume bounces along the way, but no convincing breakout. With another surge to resistance over the last few days, LUV warrants a watch for a possible breakout.
*****************************************************************

