- Charts Worth Watching: AMAT, APH, ARO, BWA, DIA, HCN, IWM, JWN, KSS, MCD, OLN, PSA, QQQQ, SPY
- Link to today's video.
- Next update will be Friday (July 10) by 9AM ET.
*****************************************************************
Short-term Gaps and Support Breaks
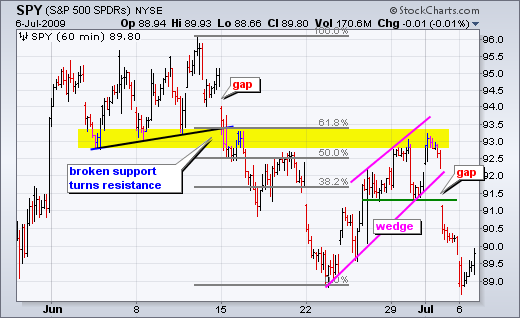
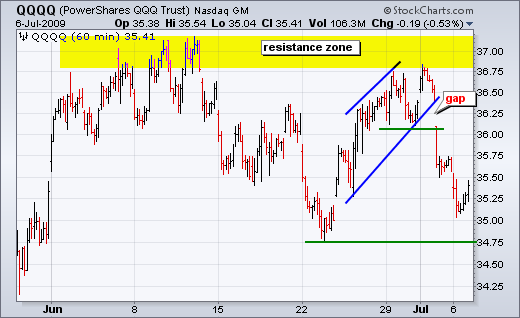
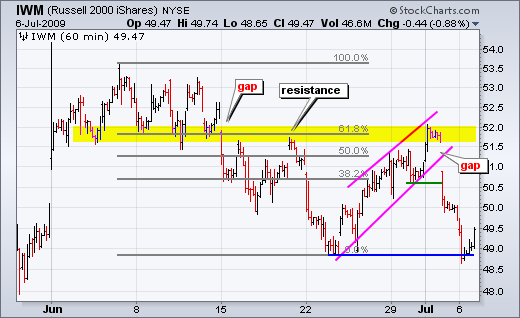
Last Tuesday I led off with the 60-minute charts showing rising wedge patterns in the S&P 500 ETF (SPY), Russell 2000 ETF (IWM) and Nasdaq 100 ETF (QQQQ). IWM and SPY met resistance near broken supports and their 62% retracement marks. They also fell well short of their June highs. QQQQ came pretty close to its June high, but fell short and formed a lower high last week. With a gap down and sharp decline, all three broke short-term support levels last week. IWM and SPY are now testing support from the June lows. Both actually breeched their June lows early Monday, but recovered and firmed later in the day. QQQQ managed to hold above its June low and continues to show less weakness (relative strength). After becoming short-term oversold Monday morning, a bounce or firmness is possible. Broken supports and last week's gaps now turn into the first resistance zones to watch.
*****************************************************************
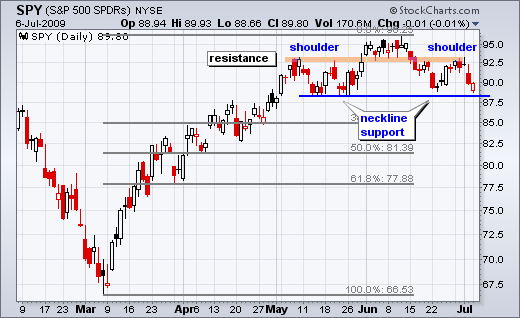
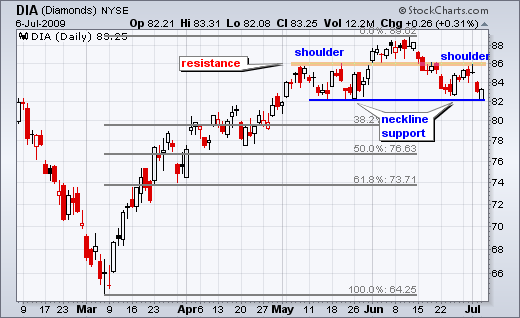
Head-and-shoulders Support
SPY and DIA traced out head-and-shoulders reversal patterns and are now trading near neckline support. The left shoulders formed in May, the heads in June and the right shoulders are currently under construction. Support from the May-June lows marks the neckline. A break below neckline support would be bearish and target a deeper retracement of the March-June advance. The Fibonacci Retracements Tool shows what a 50% retracement would entail. As long as neckline support holds, the head-and-shoulders is unconfirmed and we could still see a bounce off support. The highs from the right/left shoulders mark resistance. A break above the high of the right shoulder would invalidate this head-and-shoulders pattern.
*****************************************************************
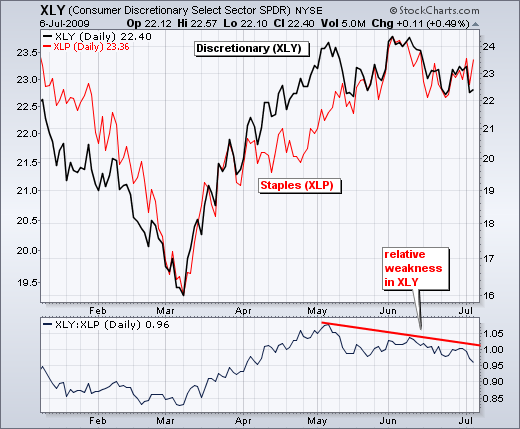
Consumer Staples Outperforming Consumer Discretionary
The Consumer Staples SPDR (XLP) has been leading the Consumer Discretionary SPDR (XLY) since May. This is negative for stocks overall. Staples represent the necessities of living: bread, toothpaste, beverages etc...). Discretionary products are, well, discretionary. We can live with them or without them. These include clothes, electronics, restaurants, hotels and travel. A rise in consumer spending benefits the consumer discretionary sector more than the consumer staples sector. Conversely, a fall in consumer spending hurts the consumer discretionary sector more than the consumer staples sector. The chart below shows both charts with the price relative. XLP exceeded its early May high by a wide margin in early June. In contrast, XLY barely exceeded its early May high. Relative weakness in XLY is also reflected in the price relative, which formed a lower high in early June and moved below its May low recently.
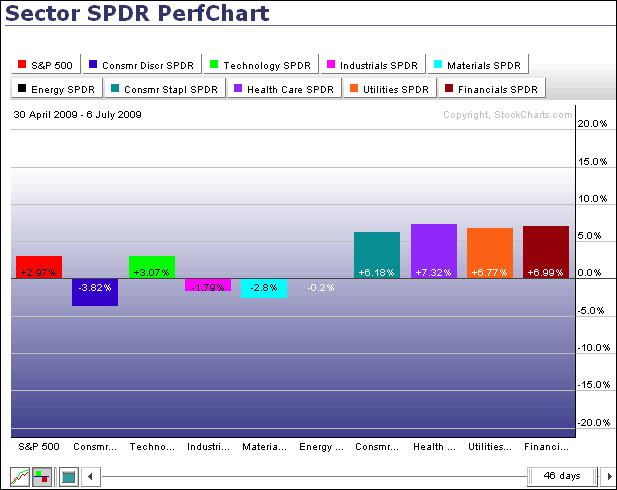
The PerfChart below shows the nine sectors with the S&P 500. The S&P 500 is up around 3% since April 30th. In contrast, the Consumer Discretionary SPDR (XLY) is down almost 4% during this same timeframe. XLY is clearly showing relative weakness. Also notice that the defensive sectors are outperforming the S&P 500. The Utilities SPDR (XLU), Healthcare SPDR (XLV) and Consumer Staples SPDR (XLP) are all up more than the benchmark index. This shows a preference for defense, which is negative for the overall market. On the positive side, the Technology SPDR (XLK) continues to hold up well.
*****************************************************************
Before moving on to individual stocks, I would like to remind everyone that earnings season is just around the corner with the majority of reports due July 20th to July 30th. With summer volumes on the low side, this could also produce a little more volatility, especially with individual shares and earnings surprises. Be careful out there. Because the major index ETFs are oversold and firming at support, the majority of today's setups are bullish.
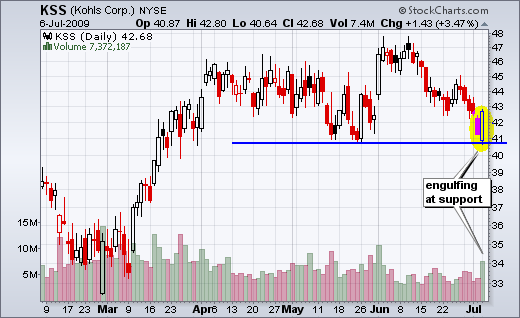
Kohls (KSS) forms bullish engulfing at the May lows. This retailer is part of the consumer discretionary sector. The stock surged in late May with good volume and then fell back to support with a decline in June and early July. After a weak open on Monday, KSS firmed and moved higher throughout the day to form a bullish engulfing. Also notice that volume was the highest since early June. This reinforces support and we could see some follow through.
*****************************************************************
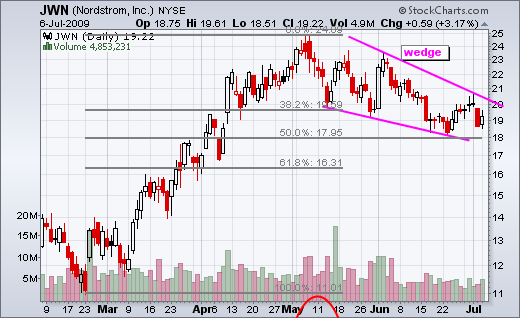
Nordstrom (JWN) is a clothing retailer that is also part of the consumer discretionary. The stock peaked in early May and moved lower over the last two months with a falling wedge. This wedge retraced 50% of the prior decline. After a gap and sharp decline on Friday, the stock managed to firm on Monday with a harami on higher volume. A follow through break above the wedge trendline would be bullish.
*****************************************************************
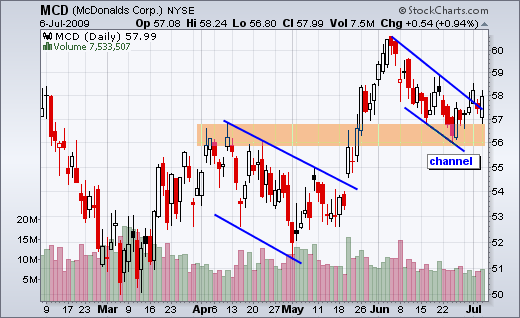
McDonalds (MCD) also showed resilience yesterday with a strong close after a weak open. Overall, the stock found support near broken resistance last week and broke channel resistance over the last few days. Volume could have been higher on the up days though.
*****************************************************************
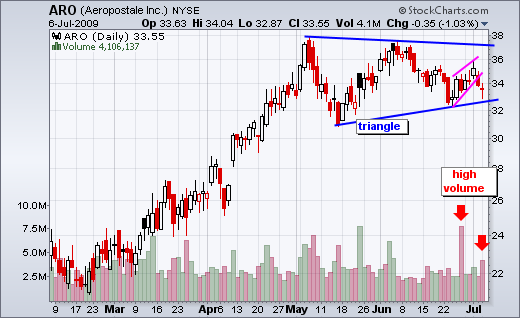
Aeropostale (ARO) is a clothing retailer that is part of the consumer discretionary sector. Overall the stock is holding up within a triangle pattern over the last two month. However, the swing within the triangle turned down with a wedge break last week. In addition, volume on the downside is starting to increase. Even though triangle support is close at hand, the little wedge break rules the roost as long as ARO remains below 35.
*****************************************************************
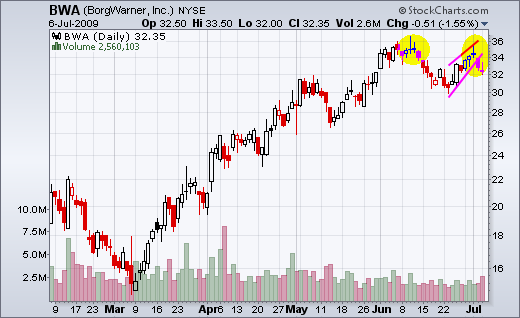
Borg Warner (BWA) breaks wedge support. BWA hit resistance at 36 in June with a couple of indecisive candlesticks (yellow circle). This indecision turned to decision with a sharp decline in mid June. After a bounce at the end of June, BWA again turned indecisive three days ago (second yellow circle). With a sharp decline on Friday, the stock broke the wedge trendline and volume picked up with Monday's decline.
*****************************************************************
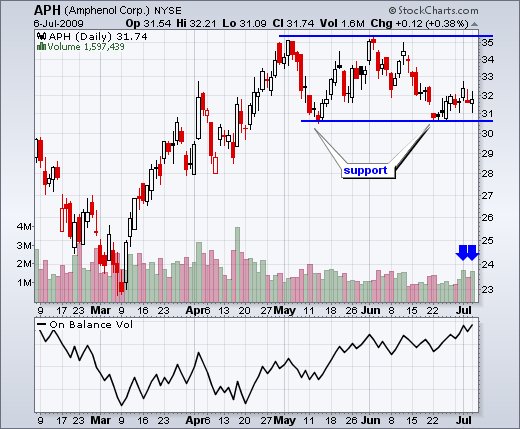
Amphenol (APH) shows signs of accumulation near support. The stock first established support around 30.5 in May and tested this level in late June. Trading has been largely flat the last two weeks, but On Balance Volume (OBV) has been moving higher. Also notice that the stock advanced on above average volume twice in the last three days.
*****************************************************************
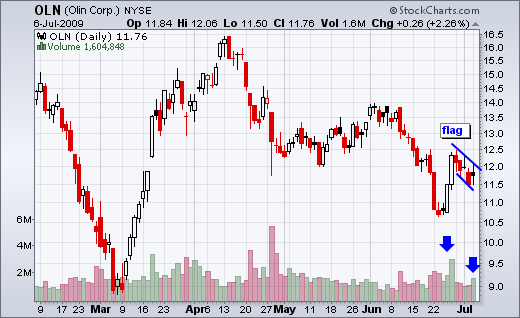
Olin (OLN) forms a bullish flag. Olin has been trending lower since mid April, but the stock surged with good volume towards the end of July. After this two-day surge, the stock pulled back with a falling flag. As a bullish continuation pattern, a break above flag resistance would signal a continuation of the two day surge. The next resistance area is around 14.
*****************************************************************
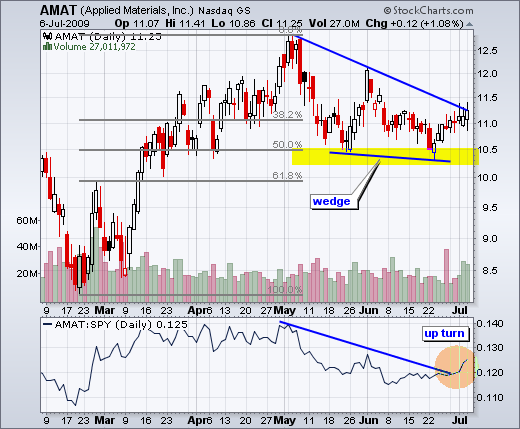
Applied Materials (AMAT) challenges wedge resistance with increasing volume. AMAT was lagging in mid June, but the stock is starting to lead with a bounce over the last two weeks. Notice that the price relative turned up and broke above its mid June highs. Volume is also increasing as the stock advanced on above average volume the last two days. More importantly, the stock held up last Thursday when the broad market was sharply lower.
*****************************************************************
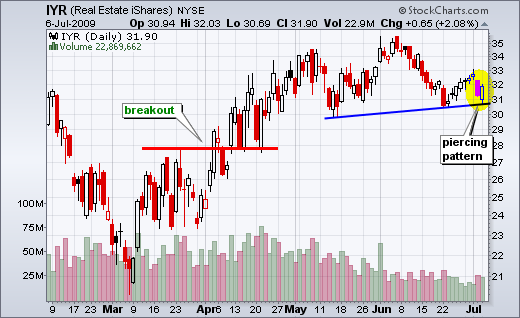
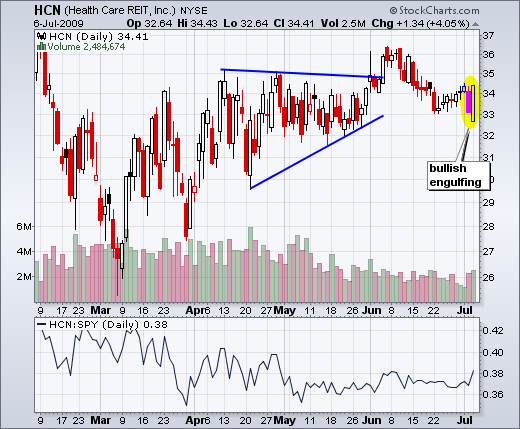
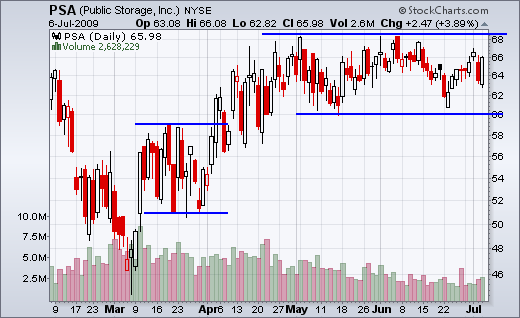
Reits lead Monday's recovery. After a weak open on Monday morning, stocks firmed and mounted a recovery in the afternoon. The REIT iShares (IYR) led this recovery with a 2.08% gain on the day. On the price chart, IYR formed a piercing pattern at support around 31. Volume was below average though and follow through is needed for confirmation. I am also showing two individual REITs that recovered on good volume Monday.
*****************************************************************

