Charts Worth Watching: AAPL, AMAT, AMZN, ARO, BMS, BMY, CAKE, CHRW, FDX, GR, IWM, JBL, JCP, LLY, NKE, OMC, PFE, PRSP, QQQQ, SPY, WPO
- Link to today's video.
- Next update will be Tuesday (July 14) by 9AM ET.
*****************************************************************
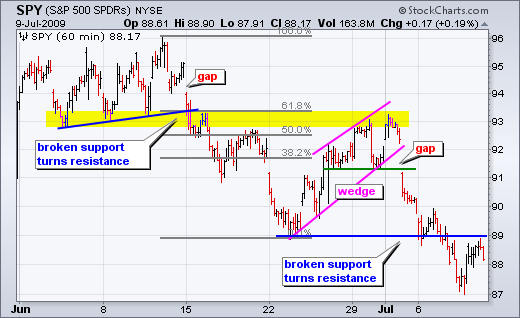
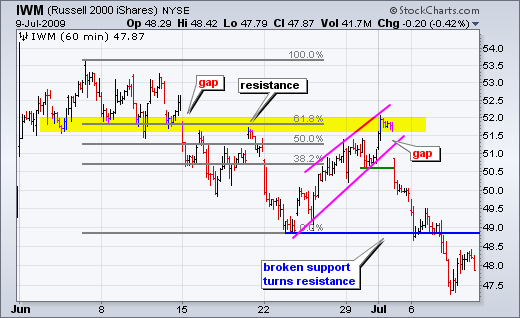
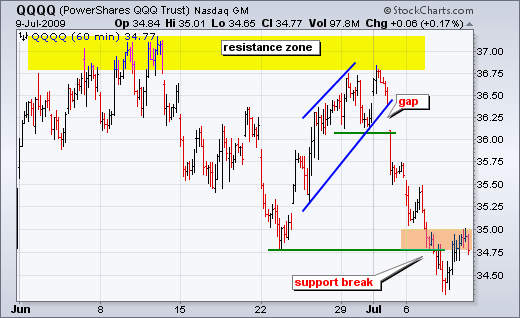
After a gap down and sharp decline last Friday, stocks became short-term oversold and were susceptible to an oversold bounce. There was a short bounce late Monday, but selling pressure reappeared on Tuesday. After a weak open on Wednesday, another shallow bounce materialized late Wednesday and early Thursday. I must say that I am not impressed with these bounces. A strong market would have bounced with more vigor. The weakness of this bounce indicates that we may see further weakness before getting a sizable oversold bounce. On the 60-minute charts, IWM and SPY broke support and broken support turns into resistance. QQQQ also broke support, but moved back above broken support. The bounce back above broken support did not hold long as QQQQ closed weak on Thursday and I see resistance around 34.75-35.
*****************************************************************
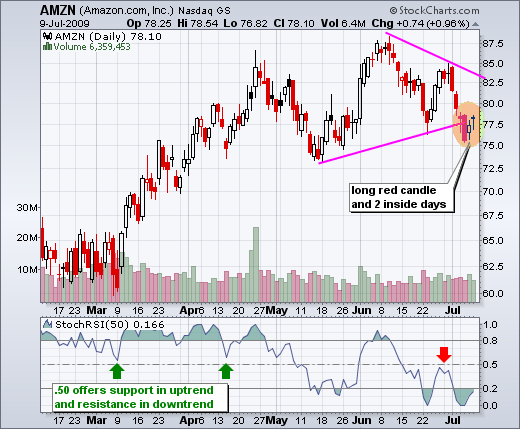
With the Consumer Discretionary SPDR (XLY) showing relative weakness and breaking its May low this week, I am still focused on this sector for weak stocks. In particular, the first group of charts focuses on retail stocks that look vulnerable. First up is Amazon (AMZN) with two inside days. The stock broke triangle support with a sharp four day decline and then formed two inside days. These represent a consolidation or sudden stall. AMZN is getting a little indecision at the support break. This also looks like a rest after a sharp decline. A break from the three day range will trigger the next signal here.
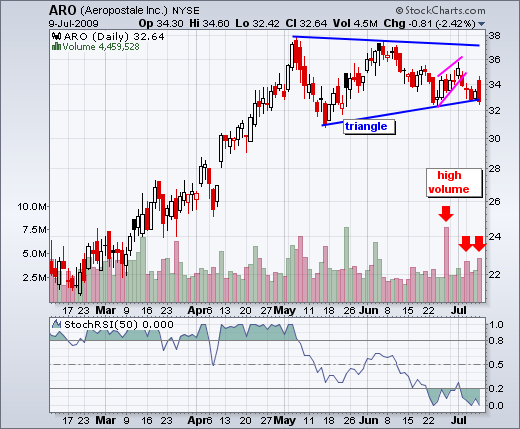
Aeropostale (ARO) has been featured over the past week and still looks vulnerable here. ARO broke wedge support with a sharp decline last week. After a strong open on Thursday, the stock closed weak to form a long red candlestick. This means the close was below the open AND the close was below the prior close. More importantly, selling pressure increased with high volume on Thursday. It looks like a triangle break in the making.
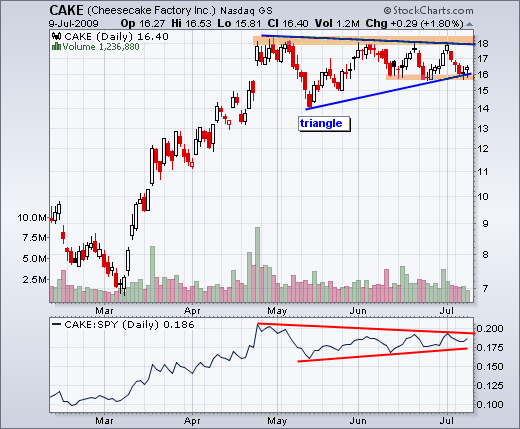
Cheesecake Factory (CAKE) continues to consolidate with lots of resistance around 18. While a breakout would be technically bullish, it ain't happened yet. The stock failed at 18 once again last week and is back near support this week. Support just below 16 stems from the lows of the last five weeks. A break below these lows would break triangle support and argue for lower prices.
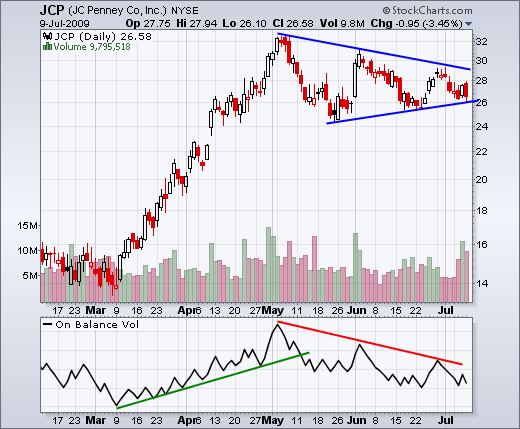
JC Penney (JCP) is also testing triangle support. Unsurprisingly, there are a number of stocks testing support from their May and/or June lows. JCP surged in early June, but fell back below 26 in late June. There was another bounce in late June, but the stock fell back again. Yesterday, the stock opened strong and closed weak to form a long red candlestick on high volume. As with ARO above, a triangle break looks imminent here. Also notice that OBV has been trending lower since early May.
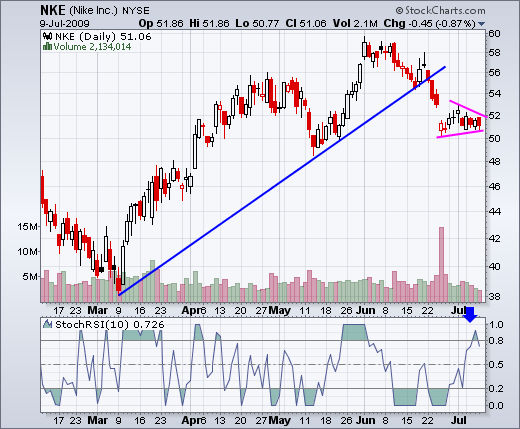
Nike (NKE) broke down with a sharp decline and gap in June. After the gap, the stock managed to firm in the low 50s over the last few days. The first decline looks like the first shoe dropping. A break below consolidation support would signal the start of the second shoe. 10-period StochRSI moved above .80 to show overbought conditions. This is a very sensitive, and often hyperactive, indicator. However, if a downtrend is indeed starting, then short-term overbought readings should occur near short-term peaks.
*****************************************************************
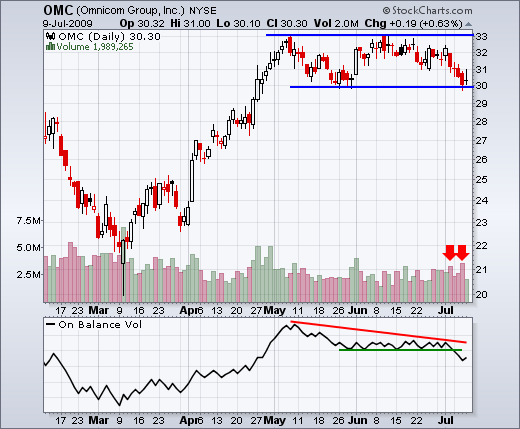
Selling pressure is picking up in Omnicom (OMC) as the stock tests double top support. The stock peaked at 33 in May and June to form the double top. After a sharp high-volume decline in July, the stock is testing double top support at 30. As a testament to increased selling pressure, On Balance Volume (OBV) broke below its June lows this week. Granville, the developer of OBV, theorized that volume leads price. It looks like volume is leading Omnicom below its June low.
*****************************************************************
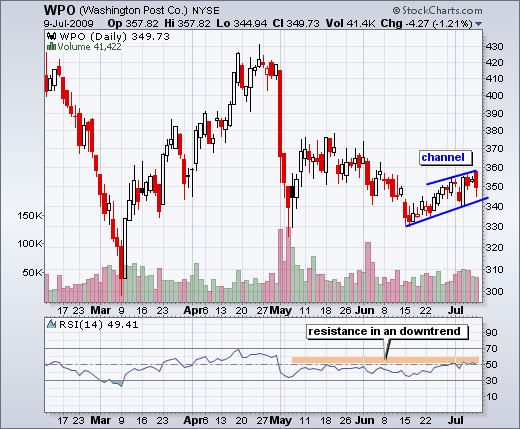
Momentum hits resistance for Washington Post (WPO). At $350 per share, this is a high-priced stock full of odd lots. It is also part of the decimated newspaper group. The stock got slammed in early May and never fully recovered. There was an oversold bounce back above 370, but WPO tested the May lows with a decline back to 330 in mid June. A channel formed over the last few weeks and a break below channel support would signal a continuation lower. RSI moved into the 50-60 zone, which marks resistance during a downtrend.
*****************************************************************
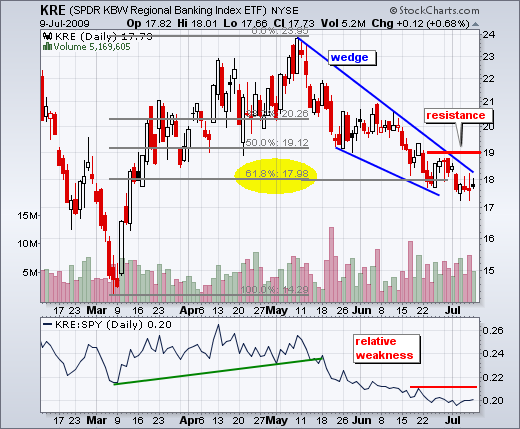
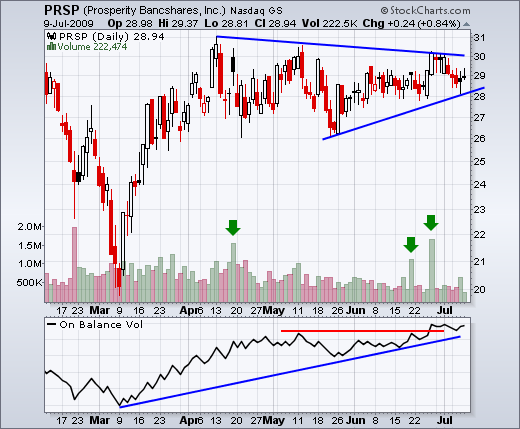
Stocks in finance sector are some of the toughest calls right now. It is still like playing Survivor. Pick the right ones and there is good money to be made on the long side. Pick the wrong ones and a lot could be lost. Risk remains high as there are still unknowns within the banking system. Relative strength may be one way to separate the contenders from the pretenders. The Regional Bank SPDR (KRE) declined sharply over the last two months. Banks that also declined are nothing special, but banks that held up well over the last two months may be survivors. With that in mind, I came across Prosperity Bancshares (PRSP). After surging with the market in March and early April, the stock traded flat the last 2+ months. Relative to the Regional Bank SPDR, the stock is holding up quite well. Should the industry turn around (KRE breakout), Prosperity could lead the way with a breakout. On Balance Volume (OBV) seems to think so as the indicator moved to new highs in late June.
*****************************************************************
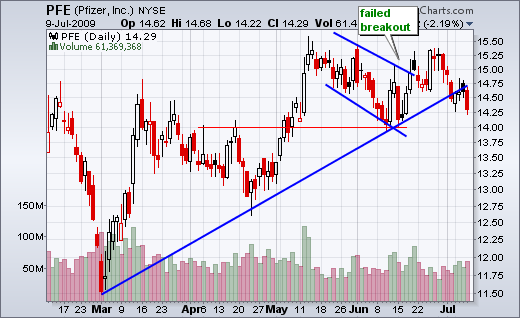
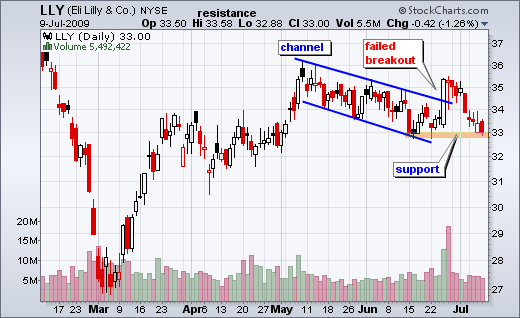
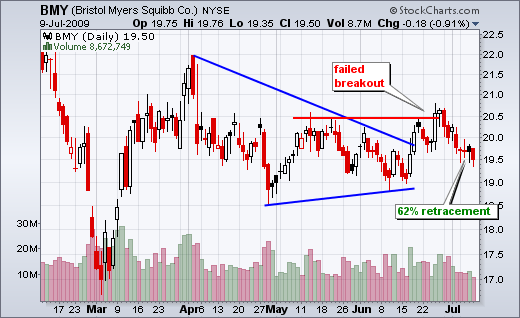
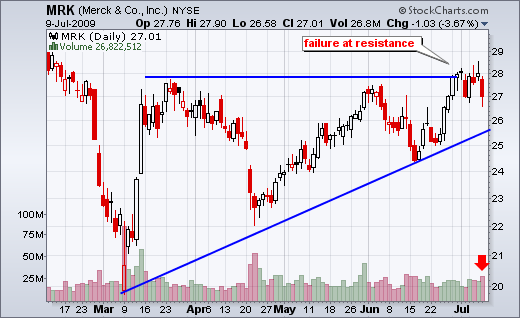
Big pharmaceuticals fail to hold their breakouts. Even though the Healthcare SPDR (XLV) is the top performing sector since early June, a number of big drug companies failed to hold recent breakouts. While a short-shallow pullback would be understandable, the decline over the last 1-2 weeks was quite sharp. Something does not seem right here.
*****************************************************************
Other stock charts covered in the video.
*****************************************************************

