- Charts Worth Watching: AKAM, AZO, BA, CHRW, DHR, DRI, ERTS, FCX, KEY, PFCB, UTX
- Link to today's video.
- Next update will be Friday (July 31) by 7AM ET.
*****************************************************************
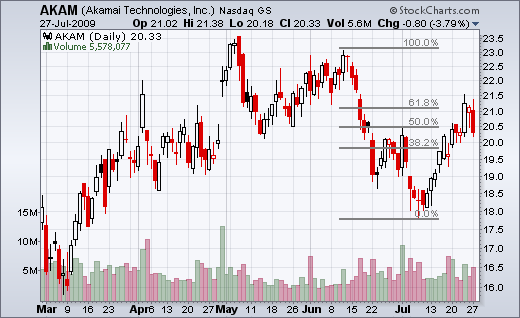
Akamai Tech (AKAM) hits key retracement with a harami. With a surge back above 21, AKAM retraced around 62% of its prior decline. A long white candlestick formed on Thursday and an inside day on Thursday. Together, these form a harami. With Monday's decline on good volume, AKAM looks vulnerable to further weakness.
*****************************************************************
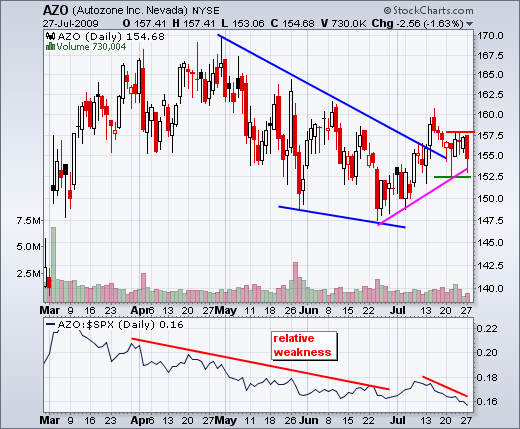
Autozone (AZO) remains stuck in a six day range. The stock appeared to break wedge resistance two weeks ago, but did not follow through when the market was strong last week. Such relative weakness is potentially negative and a break below support at 152.5 would be bearish.
*****************************************************************
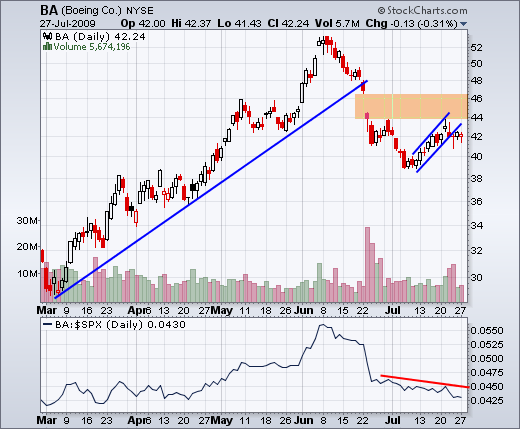
Boeing (BA) continues to lag. BA plunged in June with a large gap along the way. There was an oversold bounce with the market in July, but BA started stalling last week. Relative weakness in creeping back in and BA looks vulnerable.
*****************************************************************
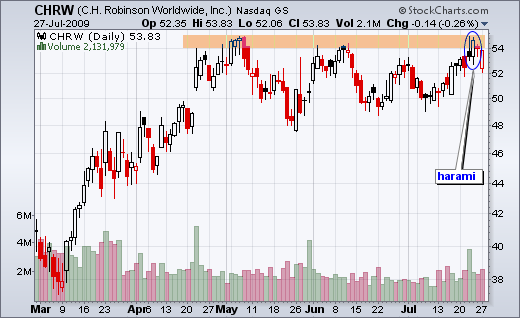
CH Robinson (CHRW) is battling resistance around 54-55. Technically, the stock is lagging because it has yet to break its May-June highs. CHRW surged on Thursday, but fell back on Friday and formed an inside day. A harami at resistance is not a good sign when the overall market looks vulnerable to a pullback.
*****************************************************************
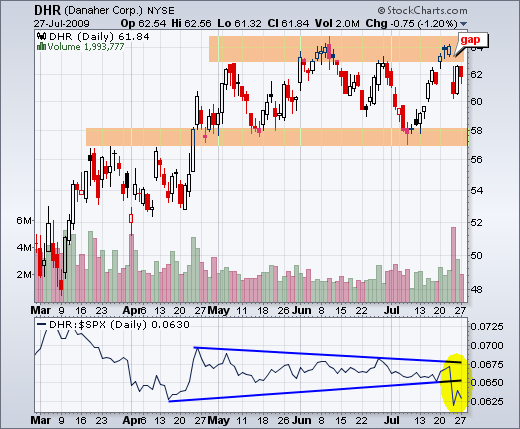
Danaher (DHR) gaps down and stays down. The stock hit resistance around 63-64 and gapped down with big volume three days ago. Resistance has been affirmed. Moreover, the stock is showing relative weakness as the price relative broke to new lows last week.
*****************************************************************
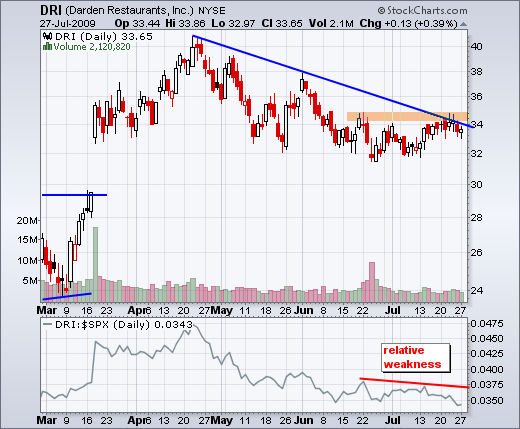
Darden (DRI) shows relative weakness as it stalls at resistance. DRI bounced in mid July, but did not follow the market higher last week. Instead, the stock met resistance from the late June highs and the April trendline. DRI also shows relative weakness as the price relative moved to a new low.
*****************************************************************
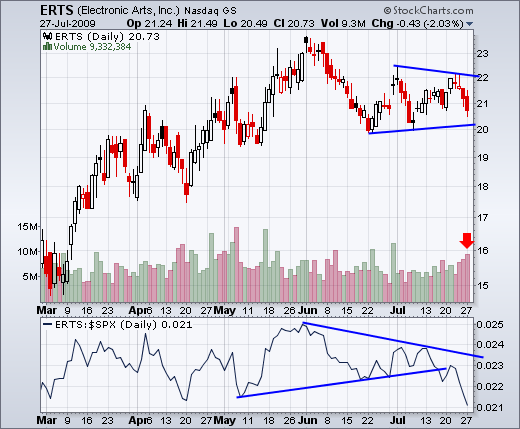
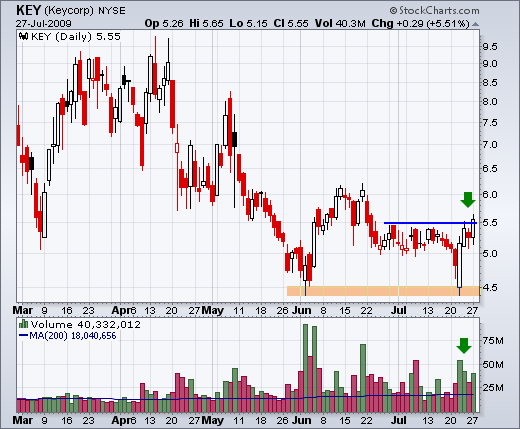
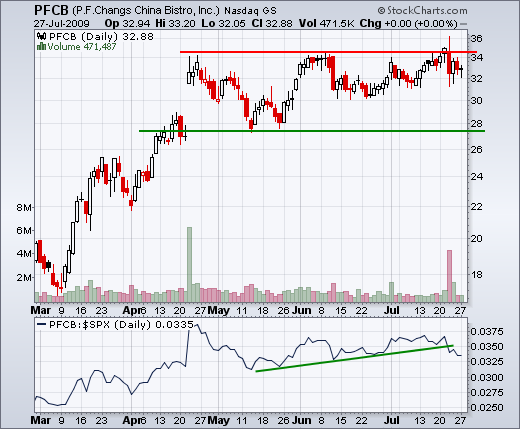
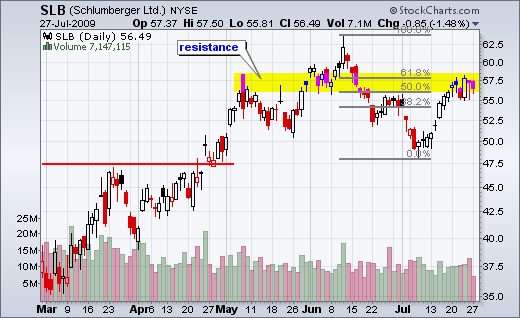
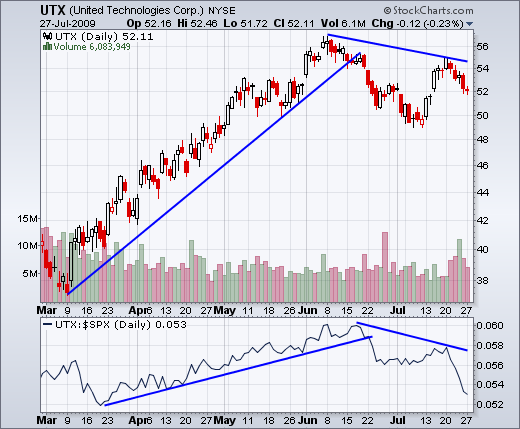
The next group of charts are discussed in the video.
*****************************************************************

