- Medium-term Outlook Remains Bullish
- Short-term Situation is Overbought
- Late Selling Pressure
- Mind the Gap
- 60-minute Momentum
- Breadth Overview
- AAII Survey Flips
- A look at Bonds and the Dollar
- Link to today's video.
- Next update will be Tuesday (August 4) by 7AM ET.
*****************************************************************
Stock Market Overview
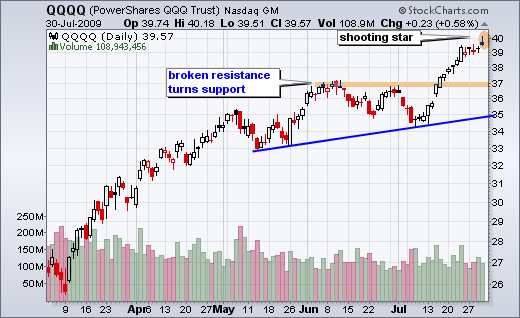
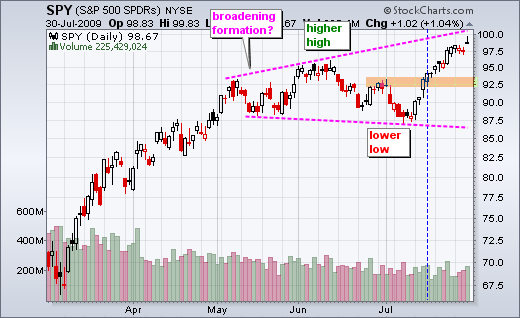
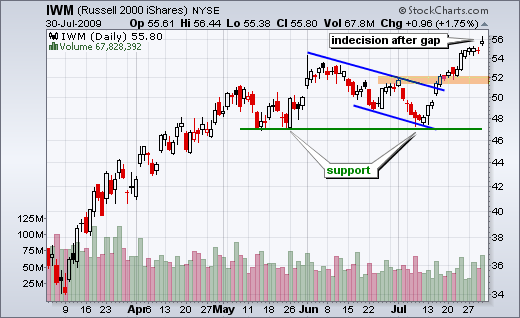
The song remains the same for the stock market. Key indicators and trend remain bullish for the medium-term (1-4 months), but overbought for the short-term (1-4 weeks). There was a whipsaw in late June when the S&P 500 ETF (SPY) and Dow Diamonds (DIA) broke below their May lows. These breaks were also accompanied by bearish signals from a few breadth indicators. The whipsaw occurred with a bullish breadth signal on 15-July and channel breakouts in DIA and SPY. Of note, the Nasdaq 100 ETF (QQQQ) and Russell 2000 ETF (IWM) never broke below their May lows. What now? Even though the major index ETFs broke above their May-June highs, extended overbought conditions argue for caution and increase the odds of a pullback.
*****************************************************************
Indecision and Shooting Stars
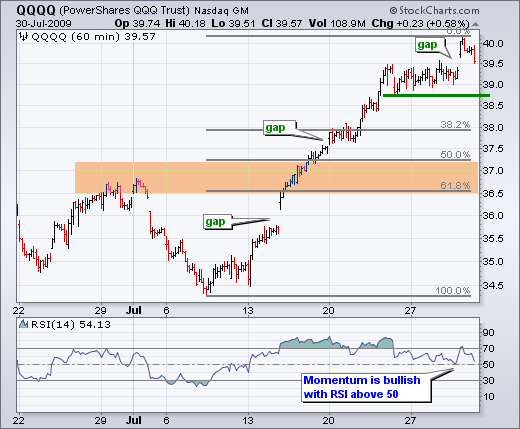
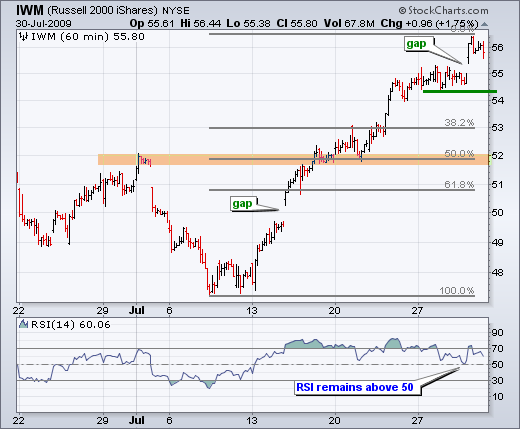
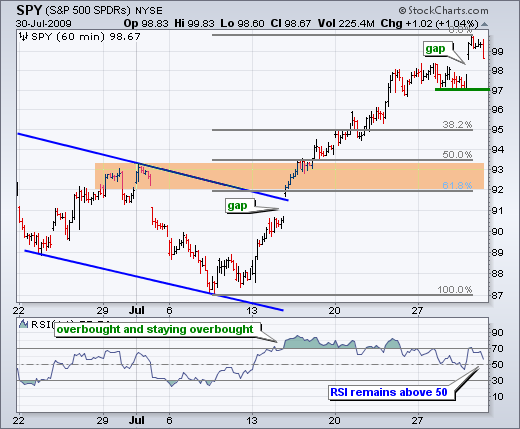
The bulls are also starting to show some caution as witnessed by the sell-off in the final hour yesterday. Stocks opened strong with a gap up and surge in the first hour of trading. These gains held throughout the day, but were cut in half with a pretty sharp decline in the final hour. This final hour decline runs counter to the final hour surges we were seeing previously. Short-term, Thursday's gaps hold the first key. Despite indecision and shooting stars, these gaps held and should be considered positive as long as they hold. A break below this week's low would fill the gap and call for the start of a short-term downtrend, which equates to a correction within the medium-term uptrend. A filling of the gap would make it an exhaustion gap.
*****************************************************************
Short-term RSI Holds 50
On the 60-minute charts, the short-term trend is up with an eye on this week's lows for key support. A break below key support and bearish signals from RSI would argue for decline towards the orange support zones. These zones stem from broken resistance and the 50-62% retracement markers. RSI has been above 50 since 13-July (14 days). Actually, RSI for the S&P 500 ETF dipped below 50 on Wednesday, but recovered with yesterday's surge. Stock market momentum would turn bearish should RSI break below 50 for all three.
*****************************************************************
Breadth Remains Bullish Overall
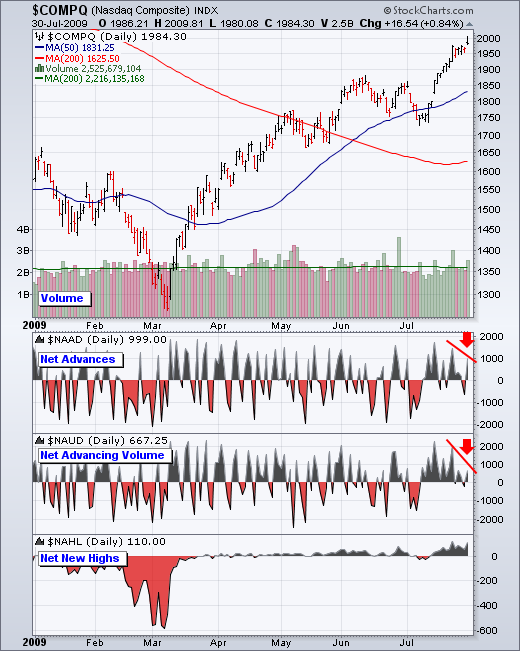
Stock market breadth remains bullish overall. The AD Lines and AD Volume Lines for the Nasdaq and NY Composite broke above their May-June highs with the July surge. The McClellan Oscillators surged above 50 and remained comfortably positive. Net New Highs continue to expand on both the NYSE and the Nasdaq. Over 84% of NYSE stocks are above their 50-day and 200-day moving averages. Over 71% of Nasdaq stocks are above their 50-day and 200-day moving averages. My current concern is for the short-term situation and the deterioration in Net Advances and Net Advancing Volume this week. The chart below shows that Nasdaq Net Advances ($NAAD) did not make it back above +1000 this week and Nasdaq Net Advancing Volume ($NAUD) fell well short of +1000. Signs of selling pressure are creeping into the Nasdaq as Symantec (SYMC), Akami (AKAM), Leap Wireless (LEAP), Fiserve (FISV), Yahoo (YHOO), Quality Systems (QSII) all got creamed on Thursday.
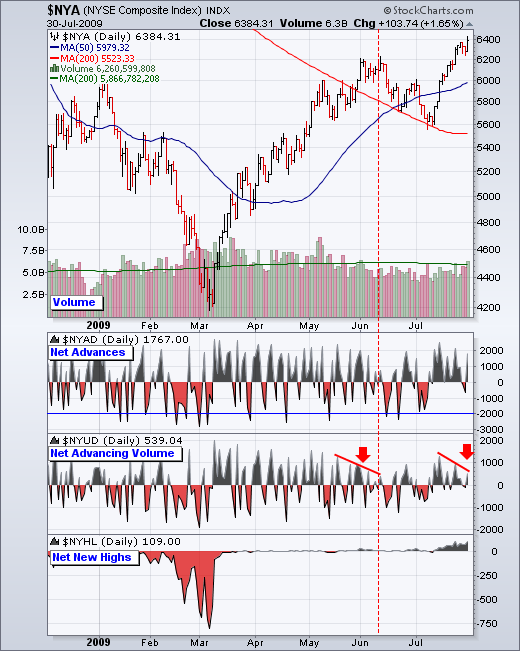
The next chart shows Net Advances, Net Advancing Volume and Net New Highs for the NYSE. Even though NYSE Net Advances ($NYAD) were not as strong as last week, performance was respectable with a +1767 on Thursday. However, Net Advancing Volume lagged significantly the last two weeks. Notice that NYSE Net Advancing Volume ($NYUD) did not surpass +1000 last week and formed a lower high again this week. A similar deterioration in late May and early June foreshadowed the last correction (red dotted line).
*****************************************************************
Bullish Sentiment Surges
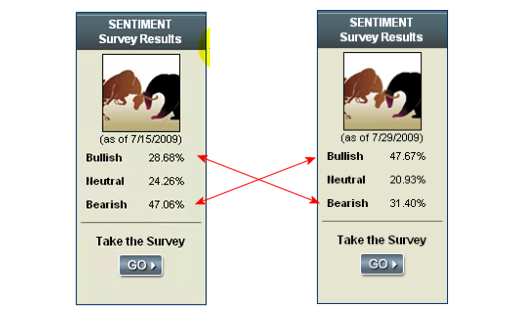
The bulls and bears did a flip in the AAII Survey over the last two days. On July 15th, 28.68% were bullish, 47.06% were bearish and 24.26% were neutral. On July 29th, 47.67% were bullish, 20.93% were neutral and 31.40% were bearish. The July rally put the bulls back in control of sentiment and this is potentially bearish for stocks. Notice how this worked on July 15th when 47.06% were bearish and the stock market surged. The bulls should be concerned when 47.67% are bullish and the market is overbought.
*****************************************************************
Volatility Continues to Contract
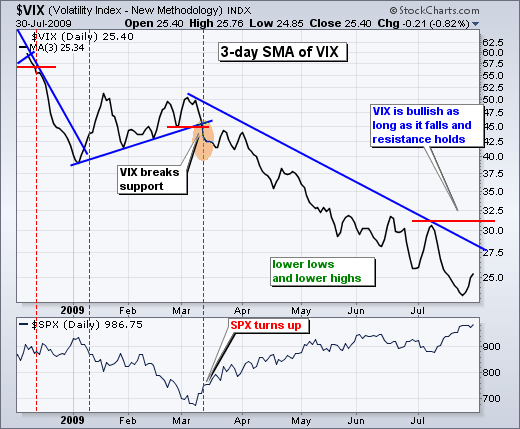
The S&P 500 Volatility Index ($VIX) and the Nasdaq 100 Volatility Index ($VXN) remain in clear downtrends. With the July rally, both moved below 25 for the first time since August-September 2008. These indices are back in the ranges that extended from July 2007 until July 2008, which saw the market decline. Volatility is associated with risk and declining risk is bullish for the stock market. As far as the medium-term trend is concerned, it would take a break above the July high to reverse this downtrend in volatility. That would produce a bearish signal for stocks. Short-term, I am concerned with the oversold nature of the VIX. In addition, notice that the VIX moved higher this week - as did the stock market. This is a bit unusual. Usually, the VIX falls as the stock market rises. Perhaps the VIX is getting ready for an oversold bounce that could coincide with a overbought pullback in the stock market.
*****************************************************************
Intermarket Turmoil Could Rattle the Bulls
Wednesday's Market Message focused on changes afoot in the intermarket arena. Namely, the Dollar and bonds surged, while gold and oil fell. Stocks are positively correlated with oil and gold, but negatively correlated with bonds and the Dollar. The table below shows the 13-week correlation of stocks to the Dollar, oil, gold and bonds. +1 is 100% positively correlated. -1 is 100% negatively correlated. For example, the correlation between the Euro ETF (FXE) and the Dollar Bullish ETF (UUP) is -.90. They are almost perfectly negatively correlated. This table confirms the positive and negative correlations for stocks.
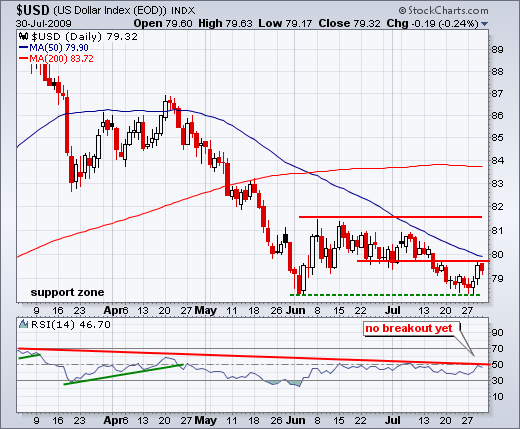
With this in mind, we should also watch the Dollar and bonds for clues on the stock market. By extension, a rise in the Dollar would also be negative for gold, oil and other commodities. The US Dollar Index ($USD) found support near the June low and surged above 79 this week. It is only a two day surge and the medium-term trend remains down. Follow through is needed to turn this bounce into something more. Downside momentum is decreasing as RSI held above oversold levels and formed a higher low in July. A follow through breakout at 50 would turn momentum bullish and increase the chances of a bigger resistance breakout.
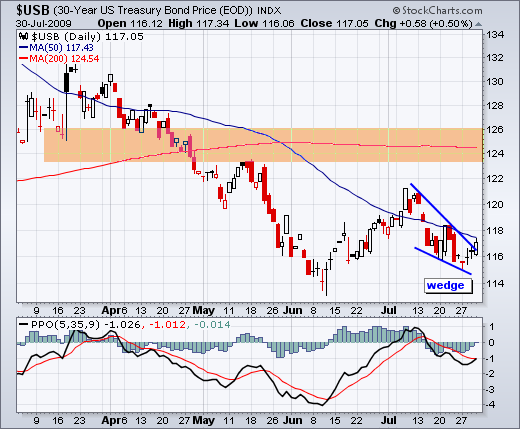
The 30-year Treasury Bond ($USB) is also showing some promising with a falling wedge over the last few weeks. This falling wedge coincided with the rise in the stock market, hence the negative correlation. Even though stocks moved higher the last four days, bonds also moved higher. Either the negative correlation is falling apart or bonds are hinting at stock market weakness. USB closed above the wedge trendline yesterday and a break above last week's high would complete the reversal. The Percentage Price Oscillator (3,35,9) turned up and further strength would push it above its signal line. Today's GDP report will likely affect bonds and the Dollar in a big way today.
*****************************************************************

