-Market Overview
-Stock Setups: AMZN, AZO, BA, DRI, ERTS, HAS, POT, RIMM
-Link to today's video.
-Next update will be Friday (August 7) by 7AM ET.
*****************************************************************
Market Overview
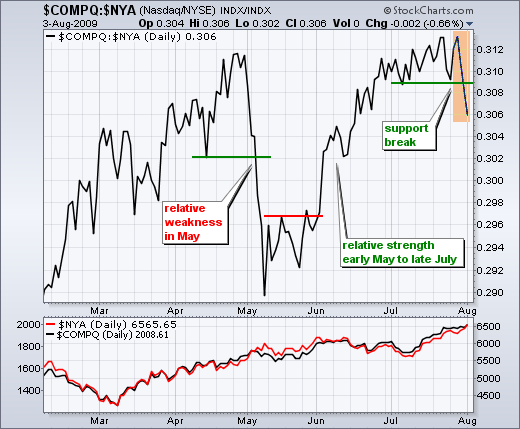
Stocks rallied on Monday with a fairly broad-based move. The major indices gained 1.5% on average and all sectors were higher. Materials led the way with a 3.54% gain. Healthcare and consumer staples, two defensive sectors, lagged the market with fractional gains. The S&P 500 moved above last week's high and exceeded 1000 for the first time since November. The Nasdaq fell a little short and closed below last week's high. In fact, the Nasdaq has actually started lagging the broader market over the last few days. The chart below shows the price relative comparing the Nasdaq to the NY Composite. This indicator broke below its July lows with a sharp decline the last few days. Notice that the last breakdown occurred in early May.
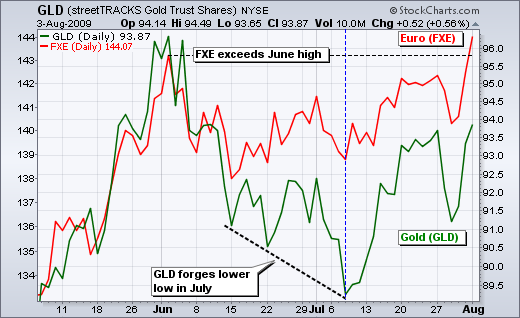
In the inter-market arena, a sharp decline in the US Dollar Index ($USD) sparked rallies in oil and gold. Bonds fell as money moved into riskier assets (stocks). The correlations continue to hold: stocks, gold and oil rise as bonds and the Dollar fall. The chart below shows the Euro ETF (FXE) and the Gold ETF (GLD). Both have been moving higher since early July (blue dotted line). However, gold is lagging the Euro somewhat. Notice that FXE broke above its June high, but GLD remains well below its June high. Also notice that GLD forged a lower low in early July, but FXE held above its June low in early July.
*****************************************************************
Short-term Uptrends Extend
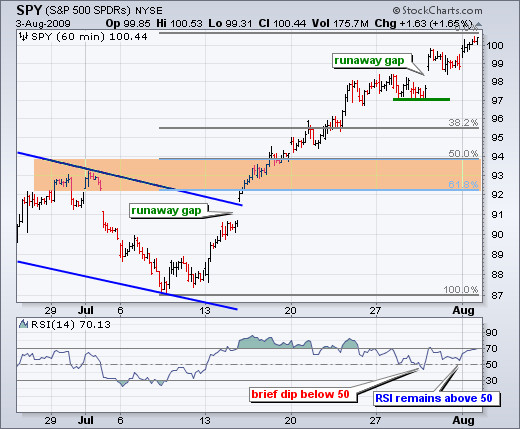
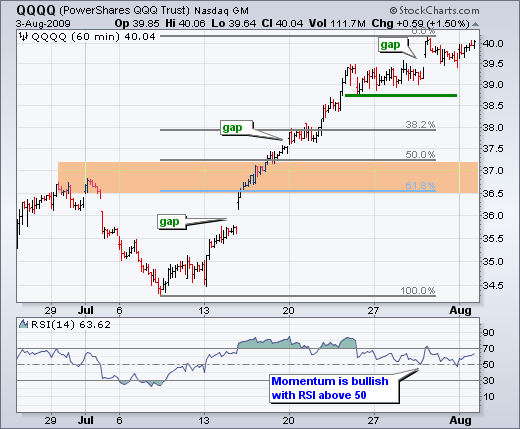
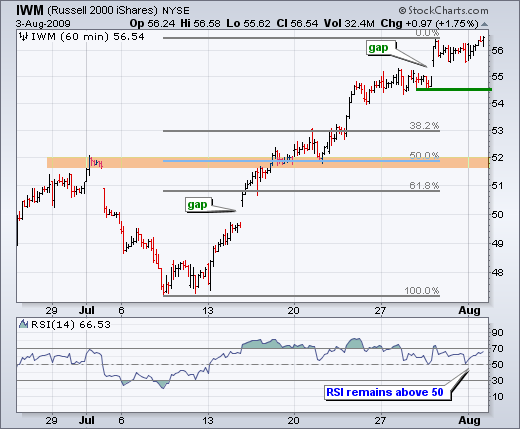
Stocks remain medium-term and short-term bullish. Even though the major index ETFs are short-term overbought and ripe for a pullback or consolidation, momentum from the buying stampede continues to push stocks higher. Pullbacks have been limited to 1-2 days, which is just like the March-April period. After a small rest last week, the short-term uptrends resumed with a gap up last Friday. There was some selling pressure Friday afternoon, but buyers returned in earnest on Monday. It is too early to call this an exhaustion gap. Right now it is a runaway gap because it is in the direction of the current trend and has yet to be filled. A filling of this gap with a move below last week's low would make it an exhaustion gap, which is short-term bearish.
The bottom indicator windows show 14-period RSI on the 60-minute charts. RSI for SPY and QQQQ dipped below 50 briefly last week, but recovered quickly to keep momentum bullish. RSI for IWM never dipped below 50. As long as RSI remains above 50 for all three ETFs, short-term momentum for the stock market remains bullish. Using RSI in this manner rules out overbought and oversold situations. Momentum is simply bullish when above 50 and bearish when below 50. For confirmation and to avoid whipsaws, I am requiring all three to move below 50 before turning short-term bearish. Once this occurs, I can then use the Fibonacci Retracements Tool to estimate a pullback.
*****************************************************************
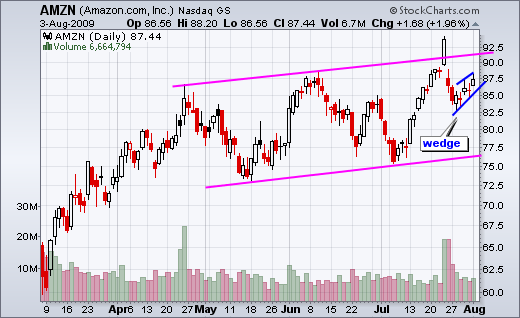
Amazon (AMZN) forms small wedge.
Amazon remains in a medium-term uptrend with higher highs and higher lows over the last few months. After a surge above 90 in late July, the stock reversed course with a gap down the very next day and continued below 85. A rising wedge subsequently formed the last five days and I am watching wedge support for a break that would signal a continuation of the late July reversal.
*****************************************************************
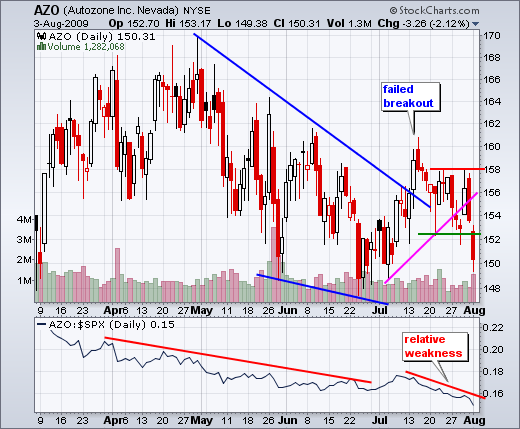
Autozone (AZO) breaks down.
Autozone attempted a breakout in mid July, but did not follow through when the market was strong in late July. After hitting resistance at 158 a few times, the stock broke support around 152 with an increase in volume on Monday. The stock continues to show relative weakness as the price relative moved to a new low. The outlook is bearish.
*****************************************************************
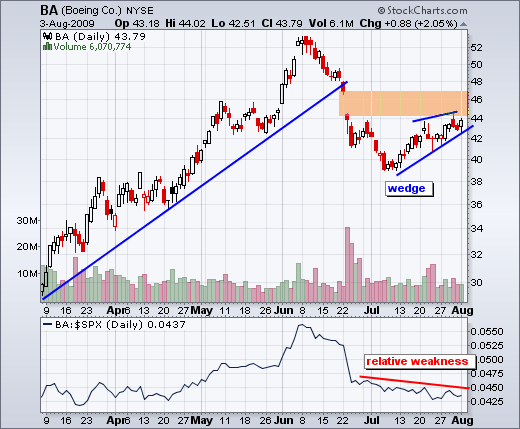
Boeing (BA) forms rising wedge.
Even though Boeing remains in a four week uptrend, this uptrend formed a rising wedge and resistance is near. Resistance stems from the June gap around 44-46. In addition, the stock continues to show relative weakness as the price relative works its way lower. A break below wedge support would signal a continuation lower.
*****************************************************************
Darden (DRI) holds support.
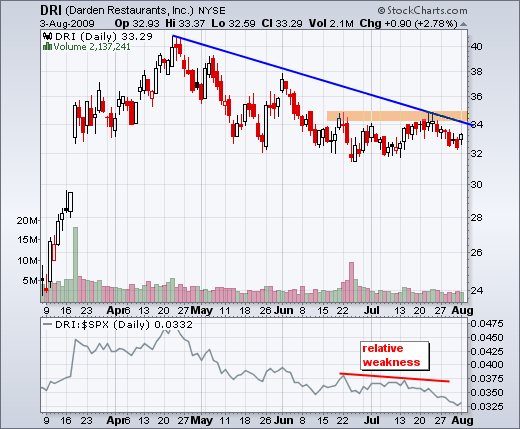
Well, what's it going to be for Darden? The stock shows relative weakness as the price relative continues to sink lower. However, the stock is still holding support around 32. With a downtrend and relative weakness, the odds favor a downside break. Look for a surge above 34.2 to suggest otherwise.
*****************************************************************
Hasbro (HAS) gets cold feet.
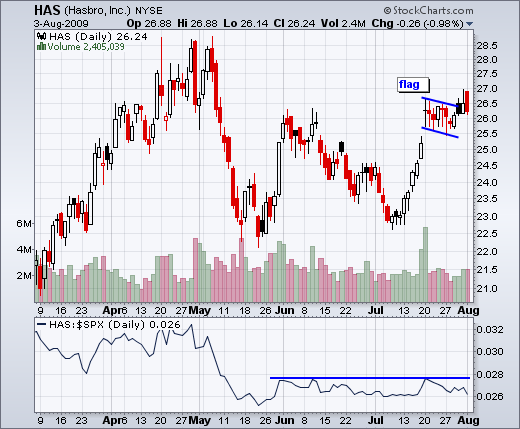
I featured Hasbro (HAS) last week with a tight flag. The stock appeared to breakout on Friday, but gave back most of its intraday gains by the close. The stock again surged with a gap up on Monday morning, but closed weak to form a long red candlestick. This is not inspiring price action for a breakout. Further weakness below 26 would call for a reassessment.
*****************************************************************
Potash Corp (POT) stalls at resistance.
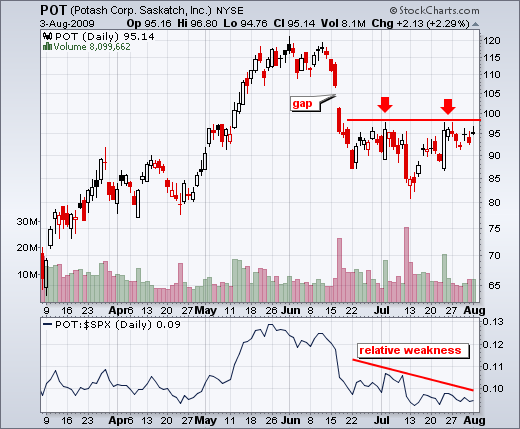
Potash started off good with two surges in mid July, but failed to follow through with a breakout. The stock continues to meet resistance around 98 from the July highs. With the big June gap and relative weakness, the odds favor a failure at resistance and a move lower. Obviously, a break above resistance would suggest otherwise.
*****************************************************************
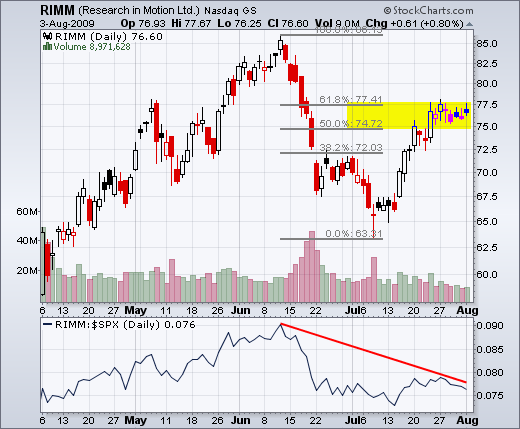
RIMM stalls in retracement zone. After plunging in June, Research in Motion (RIMM) retraced 62% with a bounce back to 77.5 in July. RIMM first pushed above 77.5 eight days ago. This means the stock has been flat the last seven days and showing relative weakness. This retracement zone is the ideal spot for a top and a break below 75 would provide the first sign of weakness.
*****************************************************************

