-QQQQ Extends Volatility Contraction
-SPY Hits Broadening Resistance
-Short-term Momentum Turns Bearish
-AAII Bulls Hit 50%
-Breadth Remains Bullish Overall
-Nasdaq Lags NY Composite
-Finance Sector Pushes Small-caps Higher
-VIX and VXN Diverge
-Intermarket Correlations
-Link to today's video
-Next update will be Tuesday (August 11) by 7AM ET.
*****************************************************************
Market Overview
Despite relative weakness in techs and frothy sentiment, the majority of my indicators remain medium-term bullish. Like the market, however, many of these are overbought and at relative extremes that can foreshadow a correction. Yeah yeah, we have heard that before. It is clear that the medium-term uptrend is trumping short-term overbought conditions. This will change one day and we will get a pullback. In fact, the evidence for an impending pullback continues to mount. Even so, we have yet to see even short-term support breaks in the major index ETFs. Price action is first and foremost in technical analysis. Until we see a convincing short-term support break, betting on the correction is fighting the current up trend.
*****************************************************************
Volatility Contraction Extends
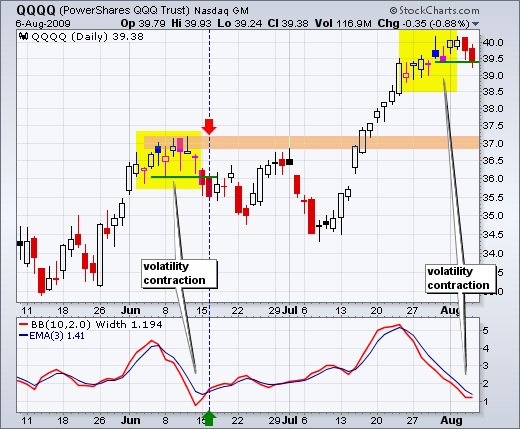
As measured by Bollinger Band Width, volatility for QQQQ has contracted to its lowest level since mid June. After showing this chart on Wednesday, QQQQ pierced support intraday on Thursday as selling pressure picked up the last two days. I am using Bollinger Band Width (10,2) because I am looking for a relatively short volatility contraction that may hint at a reversal. The blue line is the 3-day EMA. A move above would signal an upturn in volatility. Combined with a support break in QQQQ, such a signal would argue for a correction back towards broken resistance around 37.
*****************************************************************
Broadening Formation For SPY
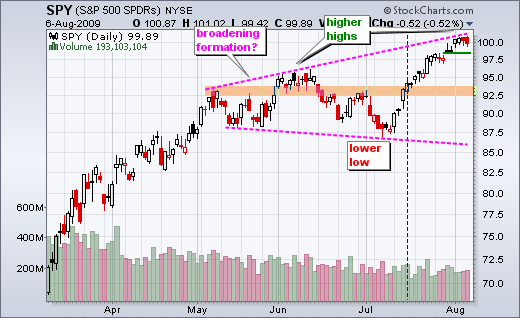
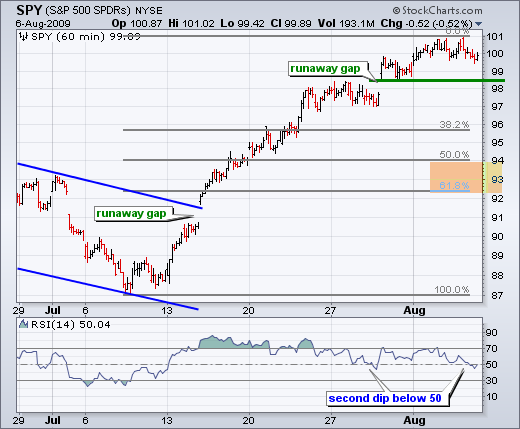
With a rally from 87.5 to 101, SPY reached the upper trendline of the broadening formation this week. You know the drill. The ETF is overbought, overextended and at a potential resistance point. If this is a 100 meter dash, then the move/race looks great - and over. However, if this is a 400 meter race, the runner may have expended too much energy too fast and may not have enough left for the last 100 meters. While this may be the case, SPY shows no real signs of weakness yet. A move below minor support at 98.4 would fill Monday's gap and argue for a correction towards the middle of the broadening formation. Until such a support break, the bulls are clearly in control and overbought conditions could persist.
*****************************************************************
Short-term Momentum Weakens
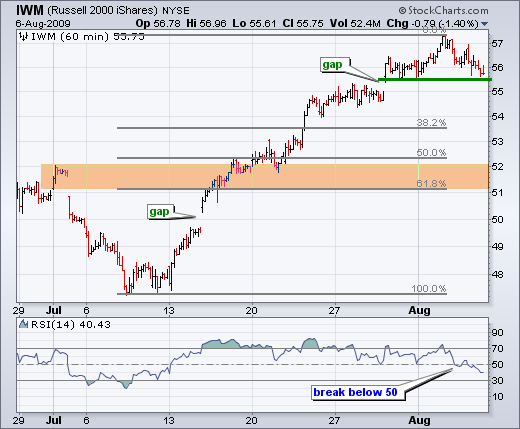
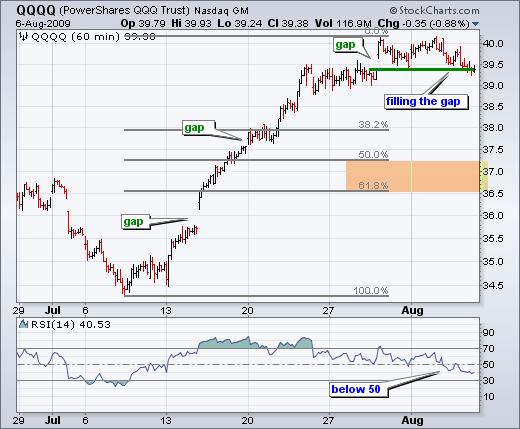
14-day RSI on the 60-minute chart moved below 50 for QQQQ, SPY and IWM. This is the first time RSI has been below 50 for all three since June 12th. A loss of upside momentum is usually the first sign of a short-term reversal. The second signal would be a break below key support levels (green lines). At this stage, turning short-term bearish is still jumping the gun or attempting to pick a top. My preference is to wait for a short-term trend changing event (decline) and then look for an oversold bounce that forms a rising wedge/flag that retraces around 50% of the decline.
*****************************************************************
Nasdaq Shows Relative Weakness
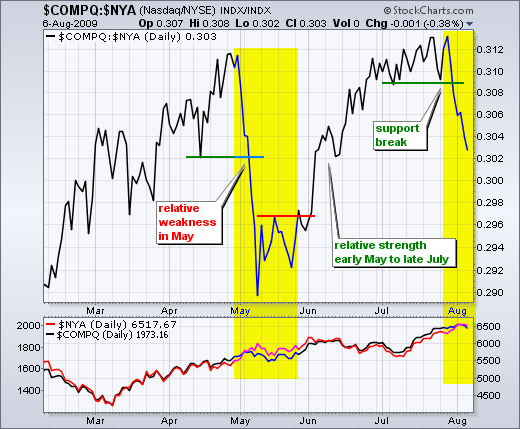
The Nasdaq has been underperforming the NY Composite for about six days now. As the chart below shows, relative weakness in the Nasdaq foreshadowed flat trading in May. There are two ways to correct: pullback or flat trading. With stocks overbought and the Nasdaq underperforming, we could be heading for another corrective period.
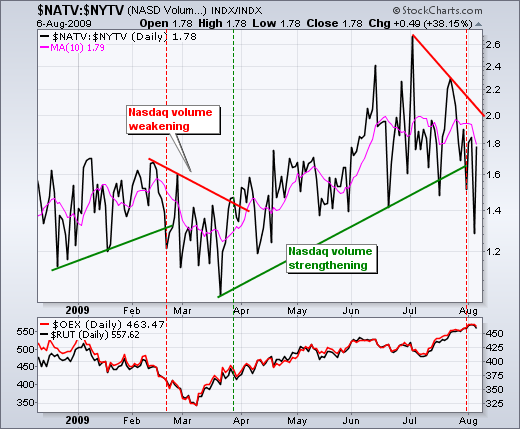
Another measure of risk appetite is the Nasdaq NYSE volume ratio ($NATV:$NYTV). It is not a perfect indicator, but it can give us an idea of money movement. The ratio bottomed at the end of March and moved higher until early July. A lower high formed in late July and the ratio broke below its May lows in August. Relative volume for the Nasdaq is weakening. This is another negative for techs.
*****************************************************************
Small-caps Show Relative Strength
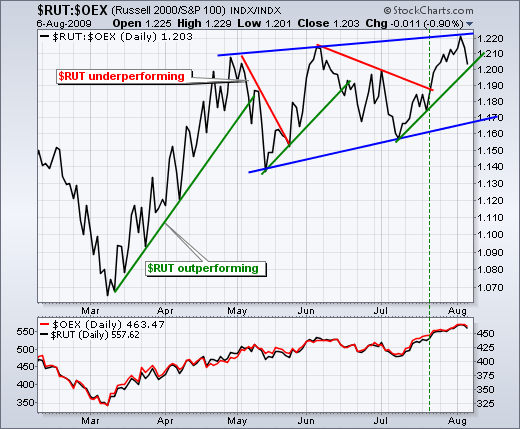
Despite relative weakness in the Nasdaq, the Russell 2000 ($RUT) is showing relative strength. This index represents small-caps. In addition, the finance sector is the single largest sector in the Russell 2000. Relative strength in the finance sector can be attributed to relative strength in the Russell 2000. On the chart below, I am watching the swings in the price relative ($RUT:$OEX ratio) for short-term signals. The current swing is up and this is bullish for small-caps. A break below 1.2 would reverse this swing and could weigh on the overall market.
*****************************************************************
Sentiment Surges
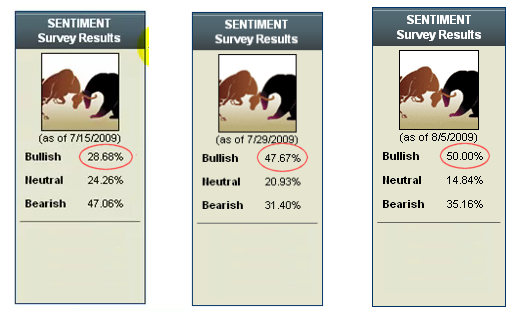
We have seen an amazing shift in sentiment over the last three weeks. Bulls in the AAII survey moved from 28.68% to 47.67% to 50%. Over this same time period, bears moved from 47.06% to 31.40% to 35.16%. Neutral appears to be the big loser here. While 50% bullish is a potential negative for the stock market, 35% are still bearish. That is a relatively high number of bears. The weekly Investors Intelligence numbers show 47.2% Bulls and 25.8% Bears (August 5th). Bullish sentiment among newsletter writers is also getting frothy.
*****************************************************************
Breadth Remains Bullish Overall
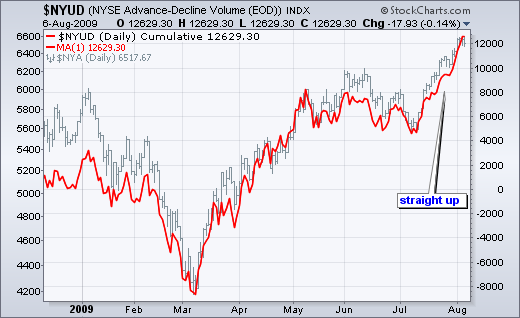
The AD Lines and AD Volume Lines for the NYSE and Nasdaq both recorded new highs in early August. In particular, the NYSE AD Volume Line moved straight up from July 13th until August 4th. New highs are testament to strength and a medium-term uptrend.
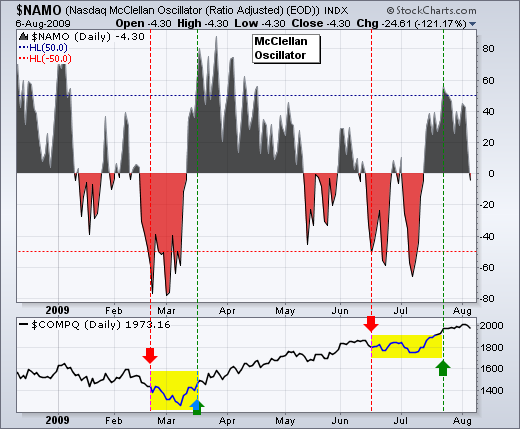
In the continuing saga of Nasdaq weakness, the Nasdaq McClellan Oscillator moved into negative territory on Thursday (-4.30). In contrast, the NYSE McClellan Oscillator remains in positive territory (+20). A move into negative territory is not a medium-term bearish signal, but it does affirm relative weakness in Nasdaq stocks. A surge below -50 would trigger a medium-term bearish signal in the McClellan Oscillator.
*****************************************************************
VIX and VXN Diverge from Stocks
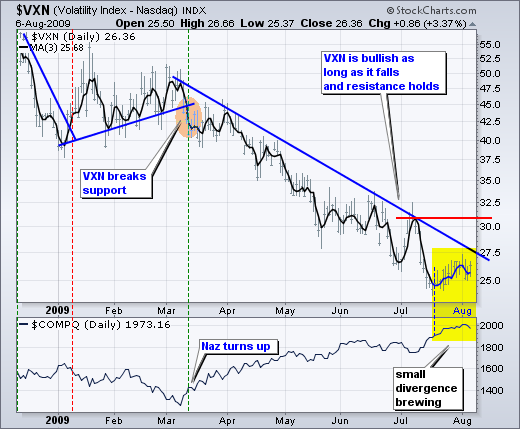
The Nasdaq 100 Volatility Index ($VXN) and S&P 500 Volatility Index ($VIX) remain in medium-term downtrends and this is bullish overall for stocks. However, I am seeing a small divergence over the last few days. VXN bottomed on July 17th and VIX bottomed on July 24th, but the Nasdaq 100 and S&P 500 both moved to new highs in early August. The stock market and the volatility indices are both moving higher. This is abnormal. Normally, these two move inverse to each other. Rising volatility suggest a big of skepticism in the August high.
*****************************************************************
Intermarket Relationships Positive for Stocks
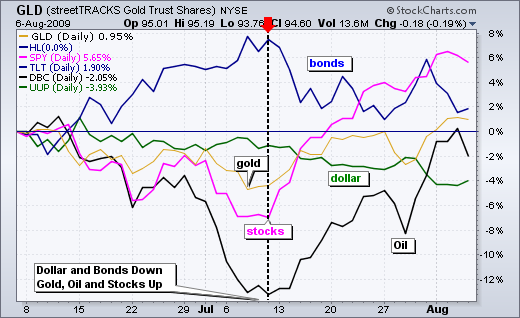
Gold, oil and stocks remain positively correlated. All three bottomed in mid July (dotted line) and moved higher over the last four weeks. Stocks and oil provided the biggest gains. Gold was up, but the rally was relatively subdued. As these three moved higher, bonds and the Dollar moved lower. The Dollar is clearly the weakest of the group. Weakness in the greenback spurred buying in oil and gold. Keep an eye on these relationships for the stock market. It is hard to pick the leader, but I would guess that the stock market is the main driver here. Continued strength in stocks would be bullish for gold and oil, but bearish for bonds and the Dollar.
*****************************************************************

